

What is the pipeline velocity formula?
Pipeline velocity is a composite. Four numbers go in, one comes out, and the output is revenue per unit of time. The compression is the point of the metric and it is also the whole problem with it.
The formula circulates in one common form: opportunities multiplied by deal value and by win rate, divided by the length of the sales cycle.
Where the unit of the answer comes from

- 1Only the divisor carries time, which is the whole reason the output is a rate and not an amount.
- 2Win rate enters without a unit, so it scales the figure without changing what the figure is.
- 3Every term enters as a plain multiply or divide, which is exactly the property that lets two movements cancel.
Each of those four belongs to different work and often to different people.
Four inputs, four owners.
| Input | What moves it | Who usually owns it |
|---|---|---|
| Number of opportunities | Demand generation and qualification | Marketing |
| Average deal value | Pricing, packaging and which segment you sell to | Product and leadership |
| Win rate | Qualification quality and how the sale is run | Sales |
| Sales cycle length | Process, procurement and how many people have to agree | Sales and the buyer |
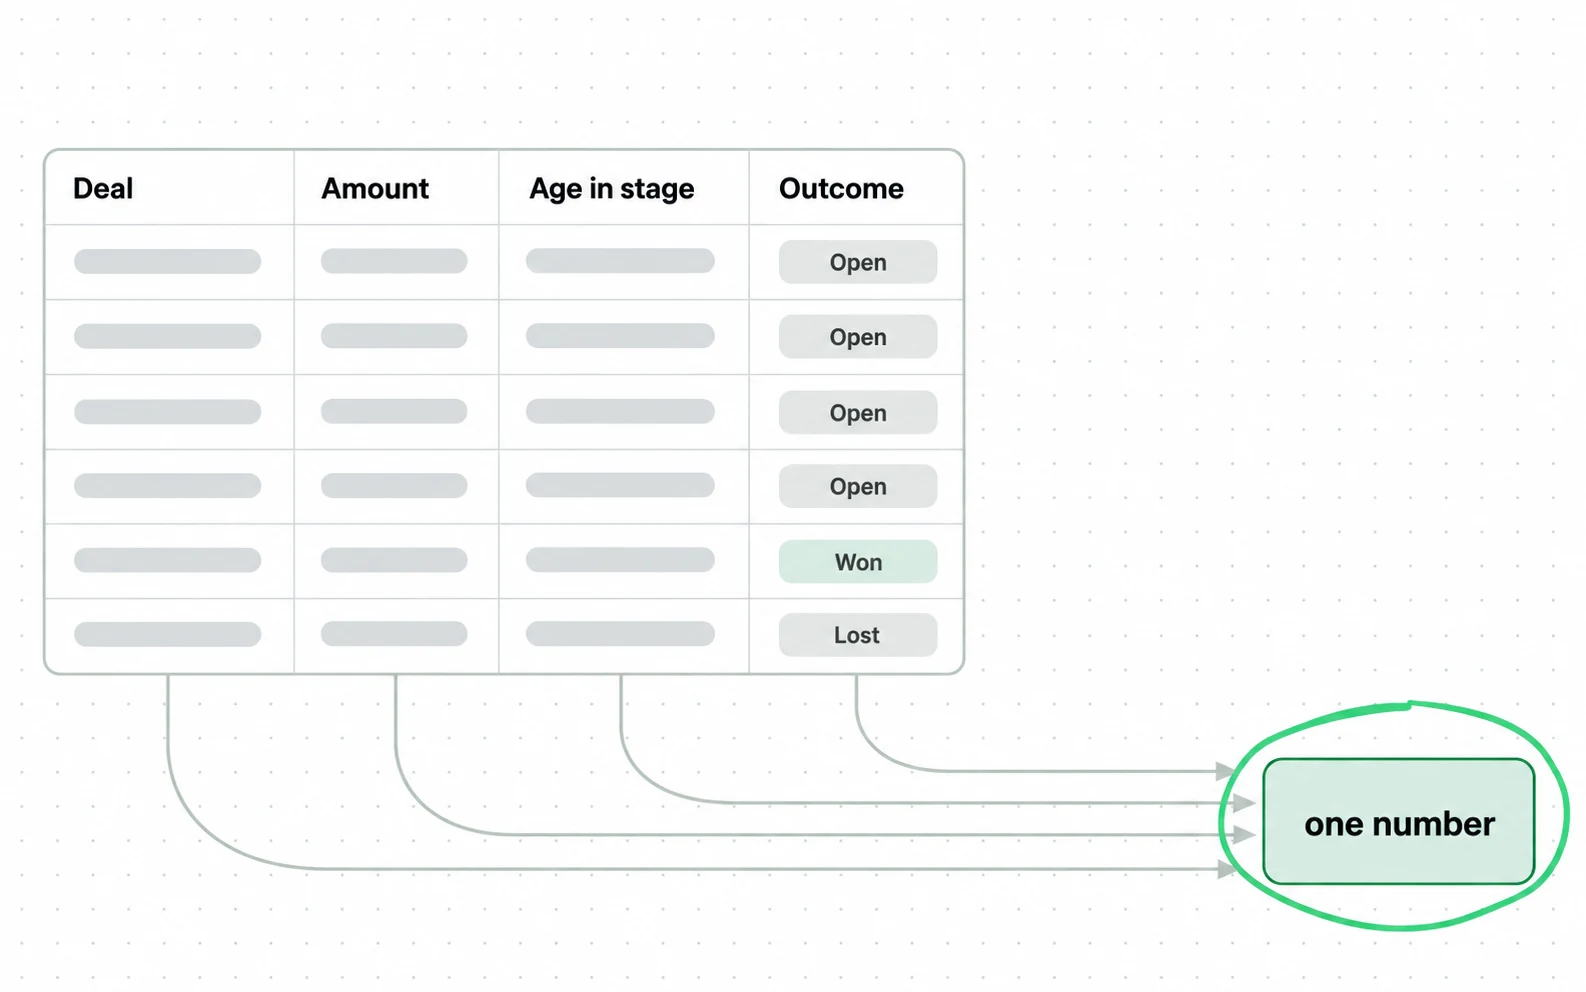
Multiply three of those and divide by the fourth, and you get one number that behaves like a summary. Summaries lose things.
How inputs can cancel each other out
The compression has a specific failure mode, and it is the reason a flat velocity is not the same as a flat quarter. Two inputs moving in opposite directions produce a number that reports nothing happened.
Take a quarter where the sales team moves upmarket. Deals get twice as large and half as likely to close.

Two large movements, and the number says nothing moved. A business that changed which customers it sells to reports a flat quarter.
What you just watched has a name outside sales writing. The OECD and the European Commission Joint Research Centre call it compensability: "the possibility of offsetting a deficit in some dimension with an outstanding performance in another."
Their handbook treats it as a consequence of how you aggregate, not of what you measure. Multiplying three inputs and dividing by a fourth buys that offsetting exactly, so halving one and doubling another hands back the number you started with.
The published advice treats each of the four as a separate improvement project, with a way to raise each one on its own. What that leaves out is the case where two move together.
Find which one moved
The decomposition is arithmetic and it takes one pass. Recompute the current quarter three times, each time putting one input back to its previous value.

Nothing in the published formula tells you to run that step. Sales writing prints the multiplication everywhere and the arithmetic that makes it usable nowhere.
Pipeline velocity as a rate or a duration
A second problem sits underneath the first. Two publishers define this term as two different kinds of quantity, and the two move in opposite directions when the pipeline improves.
The name is also used for something else entirely: the average time it takes for a sales opportunity to move from one stage to another.
That is a duration measured in days. The composite is a rate measured in money per day.
Salesforce puts the phrase on the same side. Its help page for a stage-duration report says the Opportunity History type "tracks stage transitions and duration, making it possible to analyze pipeline velocity across the team."
HubSpot attaches the label to two duration reports in its own sales analytics suite. Sales velocity there "shows how long it takes to close and win deals"; deal velocity "shows the average number of days deals take to close."
Deal velocity: this report shows the average number of days deals take to close by user or team. … Sales velocity: this report shows how long it takes to close and win deals.
HubSpot, Create sales reports in the sales analytics suite read 9 September 2026
- Deal velocity is the average number of days deals take to close. Sales velocity is how long it takes to close and win deals, with a win percentage and an average deal amount printed beside it.
- Neither is the four-input composite. The closer of the two carries three of the four and leaves the opportunity count out, and both are reported in days rather than in money per day.
So you can read a rate on one page and a duration in the product beside it, under one word. The naming runs the other way too: sales velocity is itself sometimes called pipeline velocity, or sales funnel velocity.
Speed the pipeline up and the composite rises while the duration falls. Two people reading their own dashboards will both say velocity improved and mean opposite readings.
The same formula also circulates as sales velocity, and plenty of pages use that name for it. So the term carries one formula under two names and one name over two formulas.
Pipeline velocity vs related metrics
Three neighbouring numbers get read as this one. Each is one of its inputs or one of its cousins, and using them interchangeably is how a decomposition gets skipped.
Four numbers and what each one answers.
| Number | What it answers |
|---|---|
| Pipeline velocity | How much revenue the pipeline produces per day |
| Sales cycle length | How long one deal takes, which is one of the four inputs |
| Pipeline coverage | Whether there is enough in the pipeline to hit the target |
| Win rate | What share of opportunities close, another of the four inputs |
Coverage is the one most often swapped in, because both sound like pipeline health. Coverage asks whether there is enough. Velocity asks how fast what exists turns into money.
A pipeline can have plenty of coverage and no velocity, which is a stuck quarter with a full board.
Decisions that follow from the number
Two decisions sit around this number and neither is a benchmark. Benchmarks need four identically defined inputs, and the definitions here are not even identical about what the metric is.
The first is the clock. Cycle length starts somewhere, and where it starts is a handover your team has to agree on, which is the subject of MQL vs SQL.
The second is the unit of the first input. What counts as an opportunity changes the number as much as anything the sales team does, and what a sales qualified lead is settles that.
Report the four inputs beside the figure, every time. A composite with its components printed is a summary; a composite on its own is a rumour.
Say the deal count is the input you want moved: that is where B2B PPC agency work starts at our search marketing agency.
Sources
- HubSpot blog Sales velocity: what it is and how to measure it, 7 May 2025, giving the four-input formula
- HubSpot Create sales reports in the sales analytics suite, knowledge base, updated 18 June 2026
- Salesforce Create Salesforce Report on Duration of Opportunity Stage, help article, updated 5 May 2026
- Bullhorn Pipeline velocity glossary entry, defining it as the average time between stages
- Zendesk What is sales velocity: meaning, formula and report, updated 22 September 2025
- OECD and the European Commission Joint Research Centre Handbook on Constructing Composite Indicators: Methodology and User Guide, 2008, sections 6.9 and 6.11
Questions people ask
What is the pipeline velocity formula?
Opportunities multiplied by average deal value and by win rate, divided by the length of the sales cycle. The result is revenue per unit of time, usually per day.
The same formula circulates under the name sales velocity, and plenty of pages use that name for it.
What does a rising pipeline velocity mean?
On its own it means one of four things, and the figure does not say which of them. More opportunities, larger deals, a better win rate, or a shorter cycle all raise it.
It can also mean two of them moved and one hid the other. Recompute with three inputs held at last quarter's values to see which one carried the change.
Is pipeline velocity the same as sales cycle length?
No, though the name is also used for exactly that. In that second use pipeline velocity means the average time an opportunity takes to move from one stage to another, which is a duration.
The two move in opposite directions. A faster pipeline raises the composite rate and lowers the duration, so a team using both definitions will disagree about whether velocity improved.
What is a good pipeline velocity?
No benchmark for this is published, and one would need four inputs defined the same way across companies.
They are not. Compare the number against your own previous quarters, with the four inputs printed beside it.

