

How many stages does a B2B marketing funnel have?
Say you need the number of stages in a B2B funnel for a board deck. Published models give four, three or six ending in expansion. One uses three funnel positions instead of stages. Every answer is confident, and the counts do not line up.
6sense surveyed 2,509 buyers for its 2024 Buyer Experience Report. It found 69 percent of the purchase process running before buyers engage a seller, and 81 percent choosing a preferred vendor before speaking to sales.
What 6sense measured is the stretch before a seller is engaged, so a funnel fed by sales activity is reading the later part of it.
Same subject, same month, three different answers. The chart below is what each publisher settled on, and nothing in how firms buy makes one of the counts the right one.
Gartner goes further than disagreeing about the count. Its account of B2B buying replaces the sequence with four categories of buying job, and buyers return to those jobs instead of passing through them. If that holds, the argument about four stages or six is an argument about the shape of a diagram.

Google suggests a related question asking what the five stages of the marketing funnel are. Five is not among the counts the eight models below use.
Read the labels instead of the totals and the overlap is heavy. The count follows from where the boxes sit, and you cannot read a difference in buyers off it.
Which stage labels each page uses
| Salesforce | Twilio | HubSpot | AdRoll | Cognism | monday | Gong | ||
|---|---|---|---|---|---|---|---|---|
| Awareness | yes | yes | yes | yes | yes | no | yes | yes |
| Interest | yes | no | no | yes | no | no | yes | yes |
| Consideration | yes | no | no | no | yes | no | yes | yes |
| Intent | yes | no | no | no | no | no | no | yes |
| Evaluation | yes | no | no | no | no | no | yes | yes |
| Decision | no | yes | yes | yes | yes | no | yes | no |
| Action | no | no | no | yes | no | no | no | no |
| Purchase | yes | no | yes | no | no | no | no | yes |
| Retention | yes | no | yes | no | no | no | no | no |
| Post-purchase | no | no | no | no | yes | no | no | no |
| Expansion | no | no | no | no | no | no | yes | no |
The empty column is deliberate. That model works in funnel positions: top, middle and bottom, with no stage names.
One of the four-stage versions has a long history behind it. Awareness, interest, decision and action is AIDA, a model usually dated to 1898.
That 1898 date is itself contested, and by a peer-reviewed source, so check it before you repeat it. Akinori Iwamoto of Kansai University searched the primary literature and found no writing by E. St. Elmo Lewis from that year.
Iwamoto traces the attribution to Edward K. Strong in 1925 and credits Frank H. Dukesmith and Arthur Frederick Sheldon with the formulation. If you have ever put the 1898 line in a deck, the age holds and the name does not.
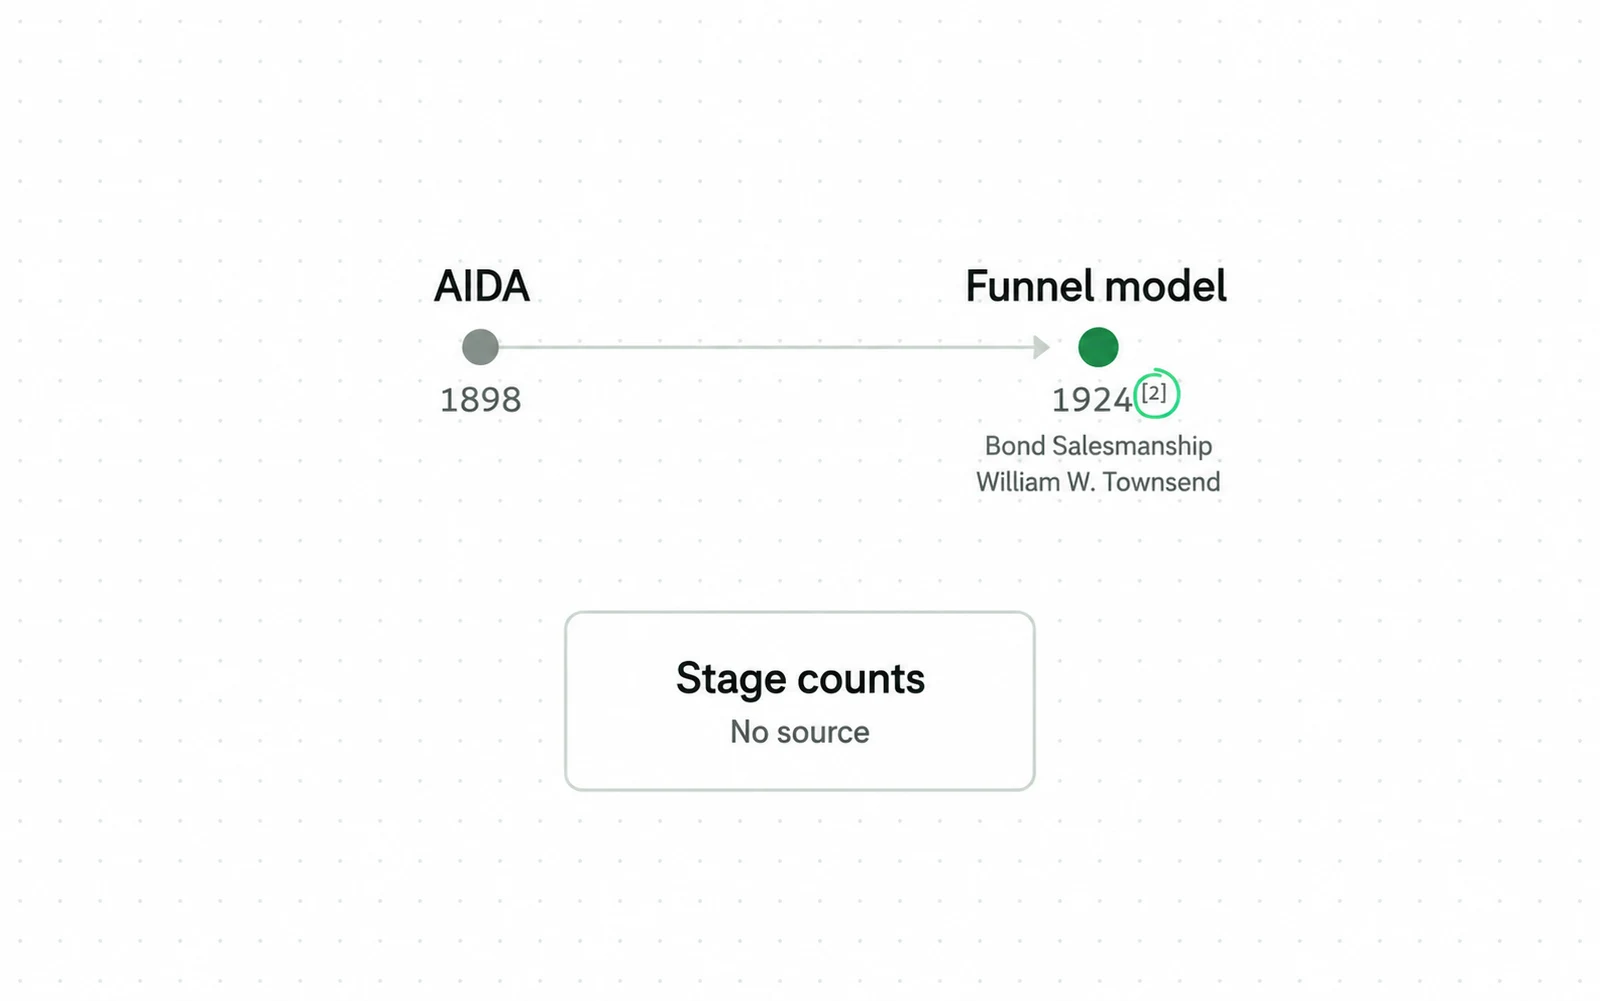
- The stages are usually dated to AIDA in 1898, and that date is contested above. The funnel shape came later, and the citation names the book and the year.
- A footnote marker sits on the claim. No such source is given for the stage counts themselves.
Old is not a criticism. A model that has survived a century is doing something right. What those guides leave out is the date, and without it a reader cannot tell settled practice from a house style.
Handoff: the point where a lead changes owner
In practice the handoff is where marketing stops owning the lead and sales starts, and it is rarely marked anywhere. Only one of the models below marks it, in a single line at the end of the intent and evaluation stage. That line is the part of a model that changes what anyone does.
Everything upstream of the handoff is a content decision. Everything downstream is a sales decision. Move the line and you move which team owns the lead, which target they carry, and which number gets read at the end of the month.
The line that changes work, and how rarely it is marked

- 1The stages are drawn once, not twice. What differs between the models is not the strip but whether the line on it exists at all.
- 2Either side of the line is an owner, not a stage. That is the part a stage count cannot tell you.
- 3One in eight is our own count across the eight models listed below, not a published statistic.
One of the three-stage models also publishes what happens inside each stage. SEO blog posts and ads at the top. Guides, ebooks, newsletters and webinars in the middle. Case studies, white papers, demos and testimonials at the bottom. That model uses three stages and the handoff model uses four, so a content plan built on one does not map onto the other.
Naming what happens inside a stage is unusual. Most published models give the stage list and leave the contents to you. One gives positions instead: TOFU, MOFU and BOFU.
Where each page puts the last marketing stage
| Page | Last stage before sales | Says who owns the handoff |
|---|---|---|
| Salesforce | Intent and evaluation | Yes, in one sentence |
| Twilio | Bottom of funnel, decision | No |
| HubSpot | Bottom of funnel, decision | No |
| AdRoll | Action | No |
| monday.com | Decision, then expansion | No |
| Gong | Purchase | No |
The handoff is also where the vocabulary changes, because a lead crossing it gets a new label. The two labels either side of that line are an MQL and an SQL, and the same disagreement runs through them.
How to set boundaries from your own pipeline data
Since the count is a drawing choice, the useful question is not how many boxes to draw. The useful question is which boundaries in your own pipeline can be observed. A boundary you cannot see in a record is a boundary you cannot report on, and it will drift.
-
List the events your systems already record
-
Draw a boundary only where an event sits
-
Name the handoff before the rest
-
Count what is left
-
Write down what each stage owns
This ordering matters because the alternative is copying a count and then hunting for events to justify it. That is the failure every published model makes visible: each one starts from a number.
Software and agency prices: published and unpublished
Running a staged funnel means paying for something that records the stages, and you can check those prices yourself. Agency retainers for running demand programmes are not published anywhere, so only the licensing half is sourced below.
HubSpot publishes Marketing Hub Starter from $7 a month a seat billed monthly. Professional starts at $800 a month with 2,000 marketing contacts and three core seats. Enterprise starts at $3,600 a month with 10,000 contacts and five core seats. Professional carries a one time $3,000 onboarding fee and Enterprise carries $7,000.
Salesforce publishes five Sales Cloud editions a user a month: Starter Suite at $25, Pro Suite at $100, Core at $195, Advanced at $395 and Max at $550. All are billed annually except Starter. Both vendors revise these figures, so check the current page before budgeting.
The number that surprises people is not the licence. Marketing automation at the professional tier starts near ten thousand dollars a year before anyone writes a word, and the onboarding fee lands in month one. A three stage funnel and a six stage funnel cost exactly the same to license. The count is not the expensive decision.
One neighbouring price reaches you in a different form. For example, the annual content survey reports a team size and no amount, so you price the people yourself. B2B content marketing collects what that survey does and does not give you.
What is not published: agency retainers for running demand programmes. No agency publishes one, so any range here would be invented.
For instance, the search half of your own programme is our B2B SEO service, priced against the stages above.
Four B2B marketing funnel mistakes at every stage
These show up whether the model has three boxes or six, because the count is not what causes them. Each is visible in guides from large vendors, and that is how they spread.
Copying a count without copying the boundaries. Suppose you take a six-stage model into a deck on Monday. By Friday you cannot say which record moved from interest to consideration, because no event marks that line in your data. The diagram stays in the deck and your pipeline runs on something else.
Leaving the handoff unnamed. Of the eight published models, one marks it. When no event marks the boundary, marketing and sales each pick their own. That leaves an argument about lead quality which neither side can settle with a record.
Treating the top of the funnel as a queue everyone joins. John Dawes at the Ehrenberg-Bass Institute set out the arithmetic in 2021. Firms change providers such as their principal bank or law firm about once every five years. Divide that across the calendar and roughly a fifth of business buyers are in the market in any year, around a twentieth in any quarter.

Dawes is careful about what the number is. He writes that the 95 percent figure is not meant to be a precise rule. He calls it a heuristic for the fact that most businesses are not in the market in a given period. It says nothing about which funnel stage anyone occupies. What it does say is that a model drawn as a path everyone walks describes a small share of the audience at any one time.
Presenting an 1898 model as current practice. If your four stages are awareness, interest, decision and action, they are AIDA. Put the date beside them in your own deck, because a reader cannot weigh a model they cannot place in time.
Carrying benchmark bands with no source attached. Summary boxes circulate ranges that read like settled figures. Lead generation at 2 to 5 percent. MQL to SQL at 20 to 40 percent. Win rates at 20 to 30 percent. Trace each one before it enters a plan. A band you cannot trace is a band you cannot defend when someone asks where it came from.
Measuring a B2B marketing funnel with sales acceptance
Your funnel produces a count per stage, and counts per stage flatter whoever drew them. The number that tests your model is what happens after the handoff, because that is the only point where another team judges your output.
Sales acceptance rate reads the same thing one level up. If the stage before the handoff is defined well, most of what crosses it gets accepted, so a low acceptance rate tells you that stage is worth examining. Where the boundary should move is a judgement no published model makes for you.
The second number is about the whole top of the funnel and not about accepted leads. First Page Sage publishes a visitor to conversion rate of 1.1 percent for B2B SaaS. The figure is drawn from client data gathered between January 2022 and August 2025, on a page last updated 18 September 2025. A vendor guide repeats the same figure, and the citation checks out against the source.
Both numbers need the same discipline from you: fix the window before you read them. Your stage count changes nothing about conversion arithmetic. If you compare a quarterly acceptance rate against a monthly one, the difference you see is an artefact of your window.
Forrester answers the stage question by dropping it. Its B2B Revenue Waterfall asks you to move beyond marketing-qualified leads and to advance opportunities with connected buying groups instead of individuals.
The same firm publishes what your buying group looks like. Thirteen people inside the organisation are involved in the decision, and 89 percent of purchases involve two or more of your buyer’s departments, on a release that does not publish its sample.
So every stage count above is drawing that room as one moving dot. For example, a lead that reaches your handoff may be one person among thirteen, and the other twelve never appear in the drawing at all.
No stage by stage drop rate for a B2B marketing funnel is published anywhere. That is why there is no funnel diagram on this page. A funnel drawing narrows, and the narrowing has to stand for a measurement. Nobody has published one, so drawing it would encode a number that does not exist.
Sources
- Forrester Transform Your Demand Process: the B2B Revenue Waterfall guide, which asks readers to "move beyond marketing-qualified leads (MQLs)" and describes "shifting from managing individual leads to identifying, prioritizing, and advancing opportunities with connected buying groups"
- Forrester The State Of Business Buying, 2024, press release 4 December 2024: "On average, 13 people within an organization are involved in the buying decision, with 89% of purchases involving two or more departments." The release does not publish its sample
- Salesforce guide What Is a B2B Marketing Funnel: four stages, and the only published sentence naming where marketing hands off to sales
- Twilio A Guide to B2B Marketing Funnels: three stages, with a content list per stage, citing First Page Sage at 1.1 percent for B2B SaaS
- HubSpot blog Inside the B2B Marketing Funnel: four stages, updated 14 July 2026, citing an average buying committee of 11 members
- AdRoll Mastering the B2B Marketing Funnel: awareness, interest, decision, action, updated 31 October 2025
- Cognism How to Build a B2B Marketing Funnel: three positions, top, middle and bottom, with no named stages, updated 24 April 2026
- monday.com B2B Sales Funnel: six stages ending in expansion, 16 March 2026
- Gong Sales funnel examples: six stages, awareness through purchase, last modified 4 March 2026
- Akinori Iwamoto, Kansai University The Origin of AIDA: Who Invented and Formulated the AIDA model?, Proceedings of the Conference on Historical Analysis and Research in Marketing, volume 21, 26 June 2023, 18 pages
- John Dawes, Ehrenberg-Bass Institute The 95:5 Rule, 2021: about 20 percent of business buyers are in the market over a year and something like 5 percent in a quarter, with the author stating the figure is a heuristic and not a precise rule
- Gartner The B2B Buying Journey: buying jobs fall within four categories and take place without a consistent order or journey
- First Page Sage B2B Conversion Rates By Industry: 1.1 percent visitor to conversion for B2B SaaS, from client data gathered January 2022 to August 2025, page updated 18 September 2025
- 6sense 2024 B2B Buyer Experience Report: 2,509 buyers surveyed, 69 percent of the purchase process happens before buyers engage sellers, 81 percent choose a preferred vendor before speaking with sales
- Oracle What is lead scoring: consider your sales acceptance rate to be the barometer of your scoring program health
- HubSpot Marketing Hub pricing: Starter from $7 a month a seat, Professional from $800 a month with a $3,000 onboarding fee, Enterprise from $3,600 a month with a $7,000 onboarding fee
- Salesforce Sales Cloud pricing: Starter Suite $25, Pro Suite $100, Core $195, Advanced $395 and Max $550 a user a month
Questions people ask
What are the 5 stages of the marketing funnel?
Five is not among the counts the eight models below use. Four use four stages, two use three, and two use six.
Where five appears, it is usually a consumer marketing funnel with loyalty or advocacy added after purchase. If you need five, you are choosing a drawing. That choice is yours to defend, and it is not a fact you can look up.
What is the rule of 7 in B2B?
An advertising heuristic says a buyer needs around seven exposures before they act, and no measurement behind it turned up.
The closest thing to a measured version is John Dawes at the Ehrenberg-Bass Institute on why advertising works by building memory instead of prompting an immediate purchase. He is explicit that his own 95 percent figure is a heuristic too.
What is a B2B marketing strategy?
A strategy decides which buyers to pursue and what to say to them. A funnel is one of the artefacts a strategy produces, and a small one.
The practical test is whether the stages in your model line up with events your systems record. If they do not, the funnel is a diagram and the strategy is running on something else.
What are the four types of B2B marketing?
This is a different question from the funnel one, and funnel guidance does not answer it.
When people ask it they usually mean channels: search, paid social, email and events. Channels are not funnel stages, and mapping one to the other is where a lot of stage lists come from.