

Build B2B content around buyer decisions
B2B content marketing helps business buyers evaluate a purchase through guides, comparisons, reports, customer stories and documentation. Each asset should answer a question that affects your buyer's decision.
Start with your operating plan. Identify who on your team will research, write, edit and distribute the work. Decide how often you will publish and when you will review progress.
A business purchase involves several people and a long evaluation. Much of it happens without you in the room. Content that answers their questions lets you take part.
Your cost and timing need separate calculations. Calculate your cost from the resources you commit, while timing depends on discovery and the buyer's purchase process.
Without a review date, nobody can say whether a slow B2B programme is on track.
Forrester's 2023 survey of more than 18,000 business buyers found that nearly 90 percent had a purchase stall that year. Content may be read months before a deal moves, so agree in advance when you expect progress.
A stalled purchase is still active. The people involved may keep reading while they compare options or wait for a budget to reopen.
Keep useful material easy to find during that wait. A buyer may return when the purchase starts moving again. For example, clear documentation can help a technical buyer answer questions while a software purchase is paused for security review.
Set a review date for each asset
A stalled purchase may continue long after the buyer first reads an asset. Set an early review for discovery, then judge sales contribution over the buying cycle.
An individual asset can reach a reader before the programme influences a sales pipeline. Check whether the asset is being found before you ask whether it helped revenue.
Give the asset a discovery checkpoint and give the programme a later commercial review. Write both dates into the plan.
In Content Marketing Institute and MarketingProfs' 2024 survey of 980 B2B marketers, 46 percent expected content budgets to increase in 2025.
An increase still needs a purpose. Fund the people and production needed for the pace you plan to sustain.

Build your amount from the roles and production inputs your plan requires.
Treat the budget as a capacity limit. A viable publishing pace leaves you enough time for research, editing and distribution.
Set each review date from your publishing pace and discovery data. Use the sales process to decide when commercial contribution can be judged.
How to support discovery and buying
Discovery and sales need separate timelines. Your budget has to support both. Discovery starts when you publish. The commercial review comes later because a buyer may read, share and revisit the page before a purchase moves.
The first timeline is discovery. A crawler has to fetch the page, the index has to keep it, and only then can it rank against existing results.
Google describes the last part of that as a range: "some changes might take effect in a few hours, others could take several months."
The second timeline is the purchase process. Your buyer reads, sends the page to a colleague, argues about a budget and waits for a quarter to turn.
Ranking data cannot show where the buyer is in that process or whether publishing shortened it.
Evaluating discovery against the full purchase timeline can make early search movement look like failure.
Strong rankings can make the programme look successful before any deal starts moving. Keep commercial outcomes in a separate report.

People received the smallest share of planned increases. Content Marketing Institute and MarketingProfs' 2024 survey of 980 B2B marketers found that 54 percent of dedicated content teams had only two to five people.
How long a new page takes to rank
A small team needs a realistic discovery timeline before it commits to a publishing pace. New pages often compete with results that have held their positions for years.
Ahrefs' 15 May 2025 study followed one million URLs first seen by its crawler in September 2023. Only 1.74 percent of newly published pages reached the top ten within a year.
Use that result to set expectations for a new page, then judge its early progress through indexation and impressions.
Ahrefs' 2023 study found that 96.55 percent of around 14 billion pages in its Content Explorer index received no Google traffic.
Publishing alone creates no discovery. Each page still needs a useful search purpose and a route into the site.
Across 1.3 million keywords, Ahrefs' 2025 study found that 72.9 percent of top-ten pages were more than three years old. The average number-one page was five years old.
Use those ages as context for the competition, not as a deadline for your page.
Ahrefs measured page performance in three ways.
| Measurement | Figure | What it counts |
|---|---|---|
| New pages reaching the top ten within a year | 1.74% | Ranking velocity for pages published in the study window |
| Top ten pages older than three years | 72.9% | The age of the incumbents you are trying to displace |
| Average age of the number one page | 5 years | One position, averaged across 1.3 million keywords |
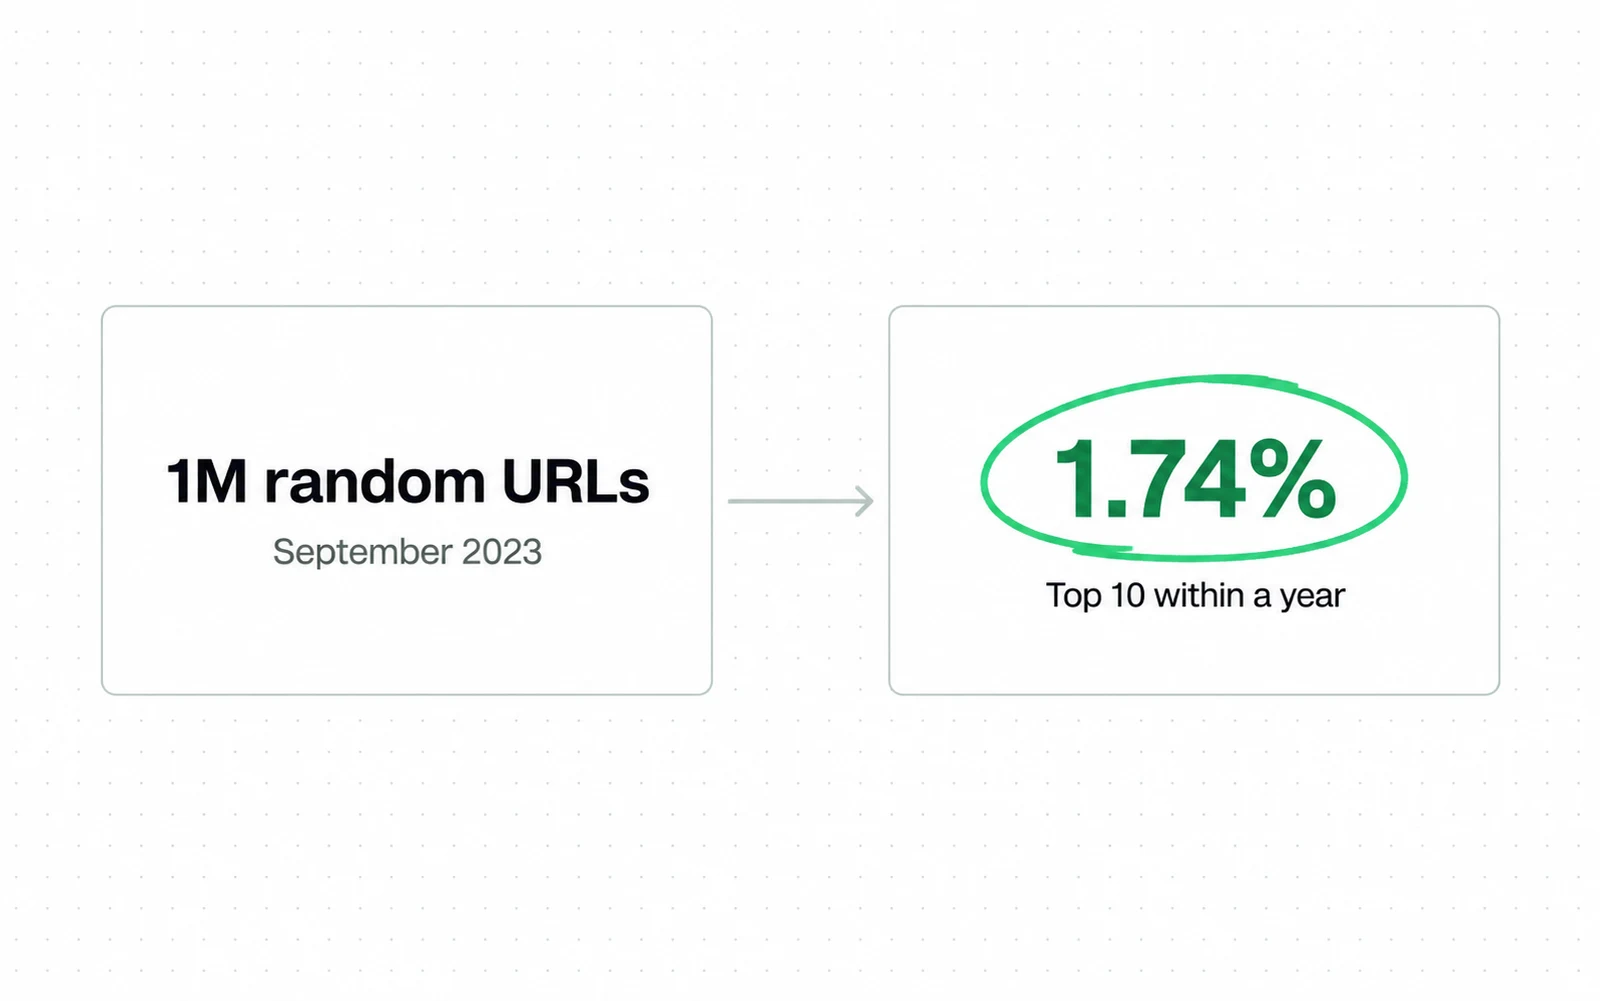
- The denominator is every newly published page the crawler saw, not the ones that succeeded.
- The study window and the sample are printed beside the figure on the same page.
Google advises waiting a few weeks before assessing whether work helped in Search. Use that interval for the first technical check, then keep watching visibility over the longer period Ahrefs observed.
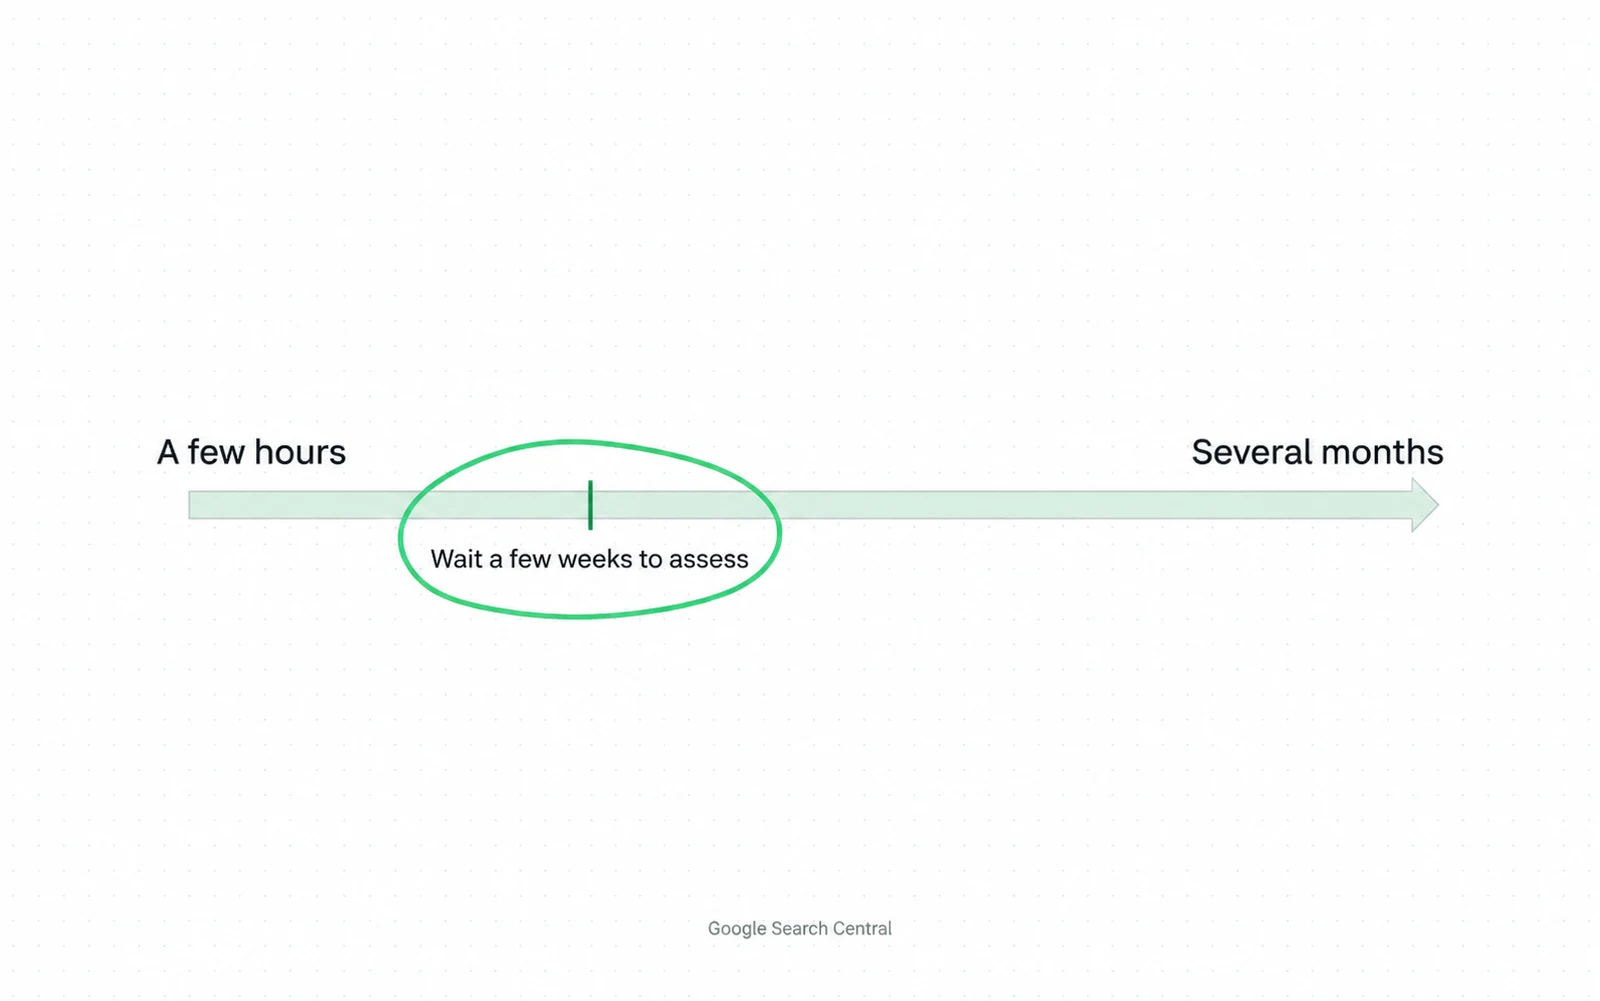
- The range is the answer. A single number would be the invention.
- The advice is to wait weeks before judging, which sets your review date for you.
Set the next review from evidence you can observe in your own account. Record whether the page is indexed, earning impressions and moving for relevant queries.
Build the review plan around events you can observe.
| Event | When to check | What to record |
|---|---|---|
| Publication | Immediately | URL, owner and intended buyer question |
| Indexation | At the first technical check | Indexed status and any crawl issue |
| Search visibility | Across the discovery period | Impressions, queries and position movement |
| Sales use | At each commercial review | Accounts, assets and questions discussed |
| Continue, revise or stop | On the written review date | Decision, owner and next action |
Keep the page's first appearance and visibility history in the discovery report.
Then report how long the resulting purchase takes. A page can be discovered early and support a decision that runs much longer.
How to build the budget
Supporting discovery and purchase requires people and production resources. Build the budget from the team and production the plan needs before setting a publishing pace.
Gartner surveyed about 400 CMOs in February and March 2025, mostly at companies above a billion dollars in revenue. The average marketing budget was 7.7 percent of company revenue.
That is the whole of marketing, and content is one line inside it.
Semrush found that 48 percent of small business owners who do not use AI tools spent $1,000 or less a month on content. Your B2B budget should instead reflect the roles and work your plan requires.
List the roles your programme needs, then price each one at the rate you will pay.
Start with the work your plan requires, then decide which roles can be combined and which need specialist help.
Price that headcount with your market rates, then add research, design, distribution and the tools the team needs.
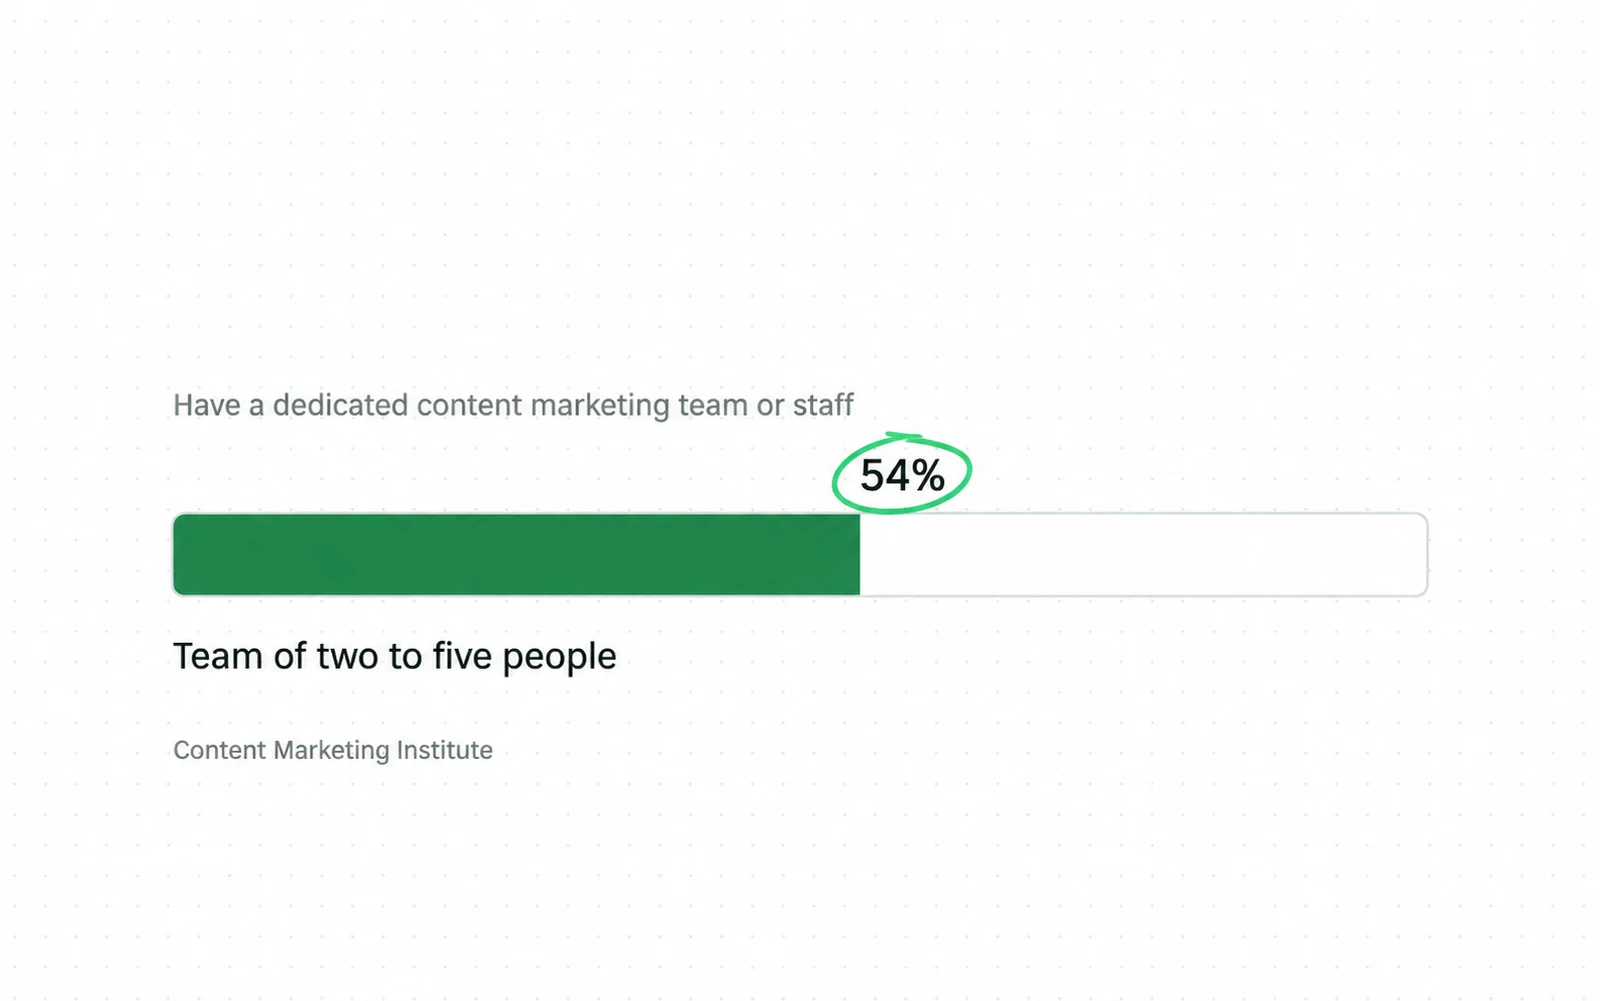
- A headcount you can price at your own rates, in your own market.
- Add research, design, distribution and tools to the headcount cost.
An editorial pipeline, one piece moving through itBuild a B2B content budget from its components
Assign the roles each piece requires, then price them at your market rates.

For example, a small team may still need outside research, design or subject review. Add those costs before you decide how often the team can publish.
Now compare the affordable publishing pace with the number of buyer questions you need to cover.
Ask a supplier for their planned publishing rate and review date. Both have one-sentence answers, and a supplier who has neither is selling you volume.
Ask one more thing: What happens to pages that do not work? A programme that only adds content has no feedback loop. Eventually, you pay to maintain a library nobody reads.
Use the same review rule when comparing an internal plan with our B2B SEO service. Decide in advance when a weak page will be revised, combined or removed.
Set the review date before the calendar
Write the review date and stopping condition before you create the first brief. With those dates recorded, every later report can say whether the plan is on track.
Before publication, run an editorial QA check to catch unsourced statistics and unclear claims.
Build each brief from buyer questions and claims your site can support. An SEO content brief can turn those inputs into a working outline.
-
Pick the date you will judge the plan. Set an early technical check, then schedule the commercial review from your sales cycle.
-
Report search discovery separately from the buyer's purchase process. A page can gain visibility before a stalled purchase resumes.
-
Price the people and specialist help each piece requires. Use that total to calculate a publishing pace the team can sustain.
-
Decide which result at the review date would tell you to stop, revise or continue. A stopping condition prevents the programme from running until someone loses patience.
Avoid three early reporting mistakes
A stopping condition only works when the report measures the intended outcome. A sound number can still create a bad decision when it answers the wrong question.
First, do not give one page the same review period as the full programme. Check whether the page is discoverable before you judge its commercial contribution.
Second, do not judge every asset by search position.
A customer story may help a sales conversation without attracting search demand. Record that use in the commercial report.
Match each asset to the channel and buyer action it was built to support.
A report sent to a list, a session at an event and a document a sales team forwards can each reach people without ever ranking. Judging every piece by position leaves those looking like failures whatever they did.
Finally, do not count output as progress. Twelve pieces a quarter describes workload, so report the buyer actions those pieces supported.
What to check at the first review
Output becomes progress when it produces the buyer actions you planned. Use the first review to check indexation, impressions and initial movement. Judge revenue at the later commercial review.
Check three things. The pages exist and are indexed. Impressions are appearing for the queries you wrote them against. Positions are moving at all.
Use these signals to diagnose a page before changing its message or abandoning the topic.
Impressions and clicks come from the same report, so read them together. If a page gets impressions but no clicks, open the query and check which meaning your page is being matched to.
If clicks rise while position stays flat, the existing visibility may be attracting more response. Check the queries and click-through rate before changing the page.
Do not require a top-ten position on your hardest term at this checkpoint. Look for relevant impressions and movement from the page's starting position.
Every early report should restate the review date next to the numbers.
The same numbers without the review date invite a question you cannot answer yet: Did it work?
And check the thing no ranking tool reports. Ask the sales team whether anything you published came back to them in a conversation.
Their answer shows whether the material entered a real buyer conversation. Record the account, asset and question it helped.
Sources
- Tim Soulo, Ahrefs 96.55% of Content Gets No Traffic From Google, 1 December 2023: around 14 billion pages in the Content Explorer index, of which 96.55 percent get zero traffic and 1.94 percent get between one and ten monthly visits, with the study stating its index leans toward higher quality pages
- Salesforce B2B Content Marketing Best Practices: defines the category and lists formats, with no cost figure and no timeframe
- Salesforce B2B Demand Generation: a full engine typically takes 6 to 12 months to show significant impact on the sales pipeline
- PathFactory 10 Inspiring B2B Content Marketing Examples: no cost figure and no timeframe
- MarketVeep B2B Content Marketing Strategies for Business Growth: no cost figure and no timeframe
- Mailchimp B2B Content Marketing: no cost figure and no timeframe, and the only page here that names the year of the research it cites
- Content Marketing Institute and MarketingProfs B2B Content Marketing Benchmarks, Budgets and Trends: Outlook for 2025, 980 B2B respondents surveyed 25 June to 16 August 2024
- Content Marketing Institute and MarketingProfs B2B Content and Marketing Trends: Insights for 2026, 1,015 B2B marketers surveyed 24 June to 14 August 2025
- The MX Group B2B Content Marketing Benchmarks, Budgets, and Trends: Outlook for 2025 key takeaways, the sponsor deck for the CMI report
- Ahrefs How Long Does It Take to Rank in Google, published 15 May 2025: 1.74 percent of new pages reach the top ten within a year, 72.9 percent of top ten pages are over three years old, the average number one page is five years old
- Google Search Central SEO Starter Guide: some changes might take effect in a few hours, others could take several months
- Semrush Content marketing statistics: 48 percent of small business owners who do not use AI tools spend $1,000 or less a month on content, and 39 percent of marketers say AI generated content takes two to three months to rank
- Marketing Brew, reporting Gartner Marketing budgets stagnate from 2024 to 2025, a trade report of the Gartner CMO Spend Survey: the average marketing budget represents 7.7 percent of total company revenue in 2025
- Forrester, carried by MarketScreener Forrester 2023 Global B2B Buyers Journey Survey, read on a MarketScreener copy of the release: more than 18,000 global business buyers, nearly 90 percent report a stalled purchase process in 2023
- FT Longitude B2B content marketing, a practical guide: one sentence about how long a B2B sale takes to conclude
Questions people ask
What does B2B content marketing mean?
Publishing material that a business buyer uses while deciding: guides, comparisons, reports, customer stories and documentation.
A practical plan also needs a budget, a review date and a stopping condition.
How long does B2B content marketing take to work?
Ahrefs' 15 May 2025 study of one million URLs found that 1.74 percent of newly published pages reached the top ten within a year. Across 1.3 million keywords, 72.9 percent of top-ten pages were more than three years old.
Google says a search change can take from a few hours to several months to appear. Set an early date to review discovery, then use your sales cycle to schedule the commercial review.
What are some examples of B2B content marketing?
A comparison page can help a buyer choose between two products. A report can give a finance team evidence for a budget request. Documentation can answer a security question before the first sales call. A customer story can show how a similar company solved the problem.