

How do publishers define B2B lead generation?
This is the rare marketing term where the definitions line up, and they line up right to the moment anyone has to count something or pay for it. After that the same four words stop being useful.
B2B lead generation is identifying the companies that could buy from you and getting them interested enough to raise a hand. Two definition pages write it as identifying ideal buyers and then enticing or attracting them.
The encyclopedia entry keeps it shorter, as "attracting and capturing consumer interest in a product or service", and the shorter version is the one that travels into ad copy without the qualifying half.
That entry is also alone among the three in defining the thing being counted. A lead, it says, is "the contact information and, in some cases, demographic information of a customer who is interested in a specific product or service." Contact details, plus interest. That is the whole object.
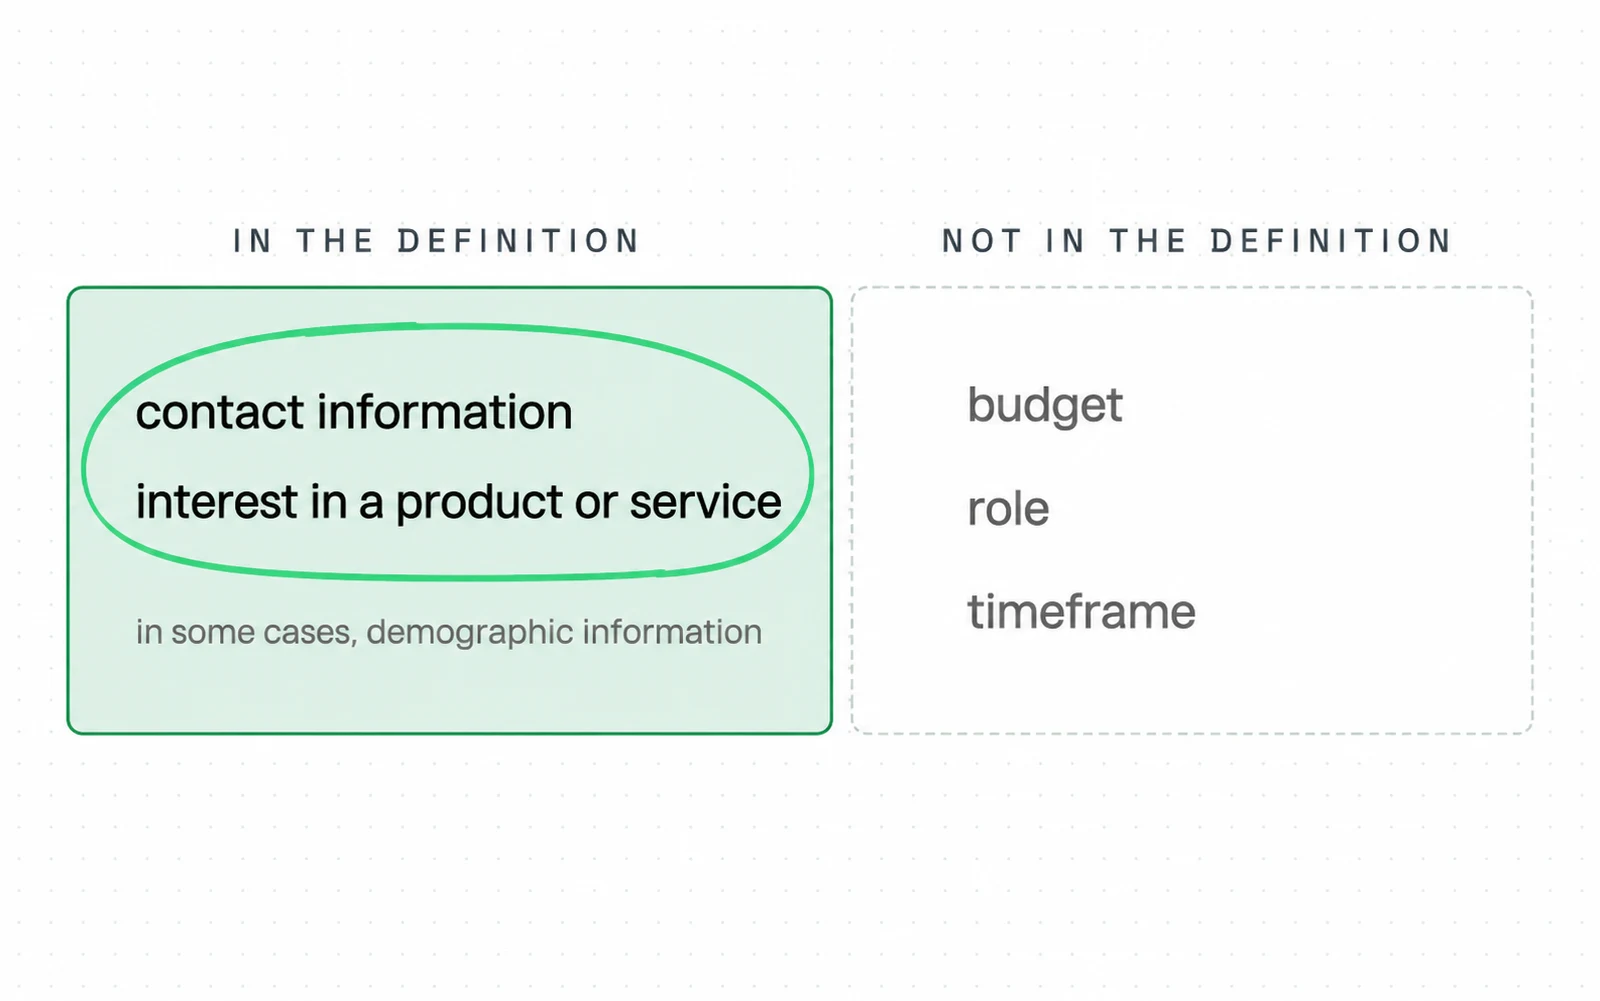
- The whole object is two things: contact details, and interest. Nothing about a budget, a role or a timeframe.
- The footnote marker sits on the definition. The pages selling you leads carry no equivalent.
That width is also why cost per lead is a metric before it is an amount: the divisor is whatever you decided to count.
Two published answers to that width exist, and they point in opposite directions. The peer-reviewed literature keeps the object and adds a step.
Migao Wu, Pavel Andreev and Morad Benyoucef reviewed 44 studies and describe qualification as ranking leads against a scale so you can prioritise them.
Forrester drops the object instead. Its B2B Revenue Waterfall guide asks you to move beyond marketing-qualified leads and to advance opportunities with connected buying groups.
So the thing this page counts is the thing Forrester wants you to stop counting. Say you win a deal after four people at one company each downloaded something: on Forrester’s reading that is one opportunity, and on yours it is four leads.
Hold onto how wide that is. Contact details plus interest covers a newsletter signup and a webinar registration. It also covers a demo request from a company that has already picked you, and a badge scan from someone who wanted the tote bag. The definition does not separate them. It asks for contact details and interest, and it leaves who decides that interest open. They are not worth the same. They do not cost the same. No published definition separates them.
The definition, as four publishers write it
| Publisher | What it says lead generation is |
|---|---|
| Zendesk | Identifying ideal potential buyers and enticing them to purchase |
| Cognism | Identifying the ideal customers, then attracting them to buy |
| SAP, as Google quotes it | Finding and attracting other businesses that might want to buy |
| Wikipedia | Attracting and capturing consumer interest in a product or service |
The platforms selling you leads do not narrow it either. Google Ads documentation for lead form assets describes what the form does, that people "submit their contact information (such as an email address or phone number)", without saying what makes a submission worth counting. LinkedIn's own guide skips the definition too. It goes straight to the part that matters to it: "one hundred unqualified leads are far less valuable than 10 qualified ones."
B2B lead generation price reports and what each counts
Google suggests a question next to this term asking what a good cost per lead is for B2B. That is the practical question. Four of the definition pages take the term on without printing an amount. So here are the reports that do, one at a time.
FirstPageSage publishes cost per lead by industry. B2B SaaS comes out at $310 paid and $164 organic. Cybersecurity is $411 and $404, IT and managed services $617 and $385, software development $680 and $510, manufacturing $691 and $415. Thirty industries, two columns each.
A second report publishes by channel instead, as quartiles. Google Search Ads runs a $60 bottom quartile, a $140 median and a $280 top. LinkedIn Ads runs $90, $220 and $380. Content marketing and SEO run $30, $85 and $180. In person events run $400, $650 and $1,200. Account based marketing aimed at one enterprise account runs $1,200, $2,800 and $5,000 and up. That top band is the price of naming the buyer before you market to them, and it only pays under conditions you can check. For example, say you sell to 240 companies at six figures a deal: at that deal size $2,800 a lead survives a conversion rate well under one in ten. Say you sell to 20,000 companies at $4,000 a deal, and it does not survive any rate you could plausibly hit. That report publishes the price and not the rate, so the rate is the input you supply. The fit test is in our guide to account-based marketing.
A third report publishes ranges: paid search $60 to $220, LinkedIn $90 to $320, organic and SEO $50 to $150 fully loaded, trade shows $200 to $600 and up. A fourth publishes averages: Google Search $45, Meta $35, LinkedIn $125, TikTok $28.
Read those four paragraphs again and notice that you cannot put them on one chart. FirstPageSage prices "paid" with no channel split. The second prices "Google Search Ads". The third prices "Paid Search", which may or may not include Microsoft. The fourth prices "Google Search". Four labels, four scopes, and not one defines its scope.
The statistics do not match either. A $45 average, a $140 median and a $60 to $220 range are three different kinds of number. Subtracting them gives you a figure, and the figure means nothing.
The same metric, as five publishers publish it, and what each one leaves out
| Publisher | Calls it | Statistic | Figure | Sample | Period | Attribution window |
|---|---|---|---|---|---|---|
| FirstPageSage | paid, by industry | one figure per industry | B2B SaaS $310 | not stated | Jan 2022 to Jun 2025 | not stated |
| GrowthSpree | Google Search Ads | median with quartiles | $140, from $60 to $280 | not stated | 2026 | not stated |
| OpGen Media | Paid Search | range | $60 to $220 | not stated | 2026 | not stated |
| ConversionStudio | Google Search | average | $45 | not stated | not stated | not stated |
| LocaliQ | cost per lead, counts conversions | average across industries | $66.69 | its own customers, no count | not stated | not stated |
A fifth report is worth naming for the opposite reason. LocaliQ, with WordStream, publishes search advertising benchmarks across more than twenty industries. It says whose campaigns it counted: "thousands of our customers' advertising campaigns across Google Ads and Microsoft Ads." Its overall figure is $66.69, with Arts and Entertainment lowest at $26.84 and Attorneys and Legal Services highest at $131.63.

That figure is not the B2B answer. It prices a conversion, not a lead, across a customer base spanning more than twenty industries, of which B2B software is one. The figure earns its place here twice over. It answers the one question the other four skip: whose campaigns produced the number. It also shows what happens when a method is held still. The spread above is what one industry choice costs, with nothing else changed. Variation this wide is normal, and the reading only breaks down when what varied goes unstated.
For instance, pricing your own lead before buying against it is what B2B PPC agency work at Addition, a search marketing agency, sets up first.
How many campaigns produced these B2B lead cost numbers?
Four things decide whether any of those five numbers can be set beside another: the sample size, the attribution window, double counting, and what made a lead qualified.
Five pages, and not one gives a number. LocaliQ names a population without counting it: thousands of its own customer campaigns. FirstPageSage is the only one that gives a data window: January 2022 through June 2025. The same page says it was last updated on 8 May 2025, before the window it claims to cover ends. Nobody else says how many campaigns, companies or leads sit behind the figure. The same page carries the line "Last updated: May 8, 2025" above a report labelled 2026.
Last updated: May 8, 2025 Our 2026 report on Cost Per Lead by Industry was prepared by our marketing research team, based on data collected between January 2022 through June 2025.
FirstPageSage, average cost per lead by industry read 5 September 2026
- A data window is given, and it ends fifteen months before the report's own label.
- No sample size. Not how many companies, not how many campaigns, not how many leads.
You cannot tell whether a lead credited to search arrived from search that day or first saw an ad two months earlier, because the attribution window is missing everywhere. You cannot tell whether the same person filling in two forms counted once or twice. And you cannot tell what made a lead qualified enough to enter the count in the first place.
That absence is about the published page, not about the work behind it. There may be a methodology sitting in a document somewhere. A reader comparing their own number to these has the page, and the page does not say.
One report names the problem and publishes averages anyway. Its own sentence about scope is worth more than its averages.
Accurate CPL calculation requires deciding which costs count and which leads qualify. Most marketers undercount costs by excluding creative production, landing page development, and tool subscriptions from their spend total. According to HubSpot's 2025 State of Marketing Report, companies that include full campaign costs in their CPL calculation report numbers 35-60% higher than those using ad spend alone.
ConversionStudio, cost per lead benchmarks read 5 September 2026
- Which costs count is a decision, not a fact. Creative, landing pages and tools are commonly left out.
- The 35 to 60 percent gap is ConversionStudio's attribution to HubSpot's 2025 State of Marketing Report. It was not verified in that report.
On that attribution, companies including full campaign costs report figures 35 to 60 percent higher than those counting ad spend alone. That compares reporting conventions, not one campaign counted two ways. Nobody publishing a benchmark tells you which convention theirs used.
Tables that mix registrants and qualified leads
The scope problem shows up when you compare publishers to each other. A second problem needs no comparison at all. It sits inside a single report, in two lines of the same table, under one heading.
One report prices webinars and virtual events at $35 to $160 per registrant. Two lines later it prices content syndication at $45 to $130 per verified marketing qualified lead. A registrant is a person who typed an email address into a form. A verified marketing qualified lead has been checked against a definition of fit. Both appear in the same table, under the same heading, as cost per lead.
Another report prices the webinar channel per lead, at a $150 median, against that $35 to $160 per registrant. Whether those two describe similar campaigns is not knowable from either page: neither says what the offer was, who the audience was, or how a registrant became a lead.
Three denominators, one label
| What it takes to become one | Published as | |
|---|---|---|
| A lead | Contact details plus interest | Cost per lead |
| A webinar registrant | A form submission before an event | Cost per lead |
| A verified qualified lead | A submission that passed a fit check | Cost per lead |
This is why a low benchmark is not automatically good news. For instance, suppose two teams each spend $10,000 on webinars. One counts registrants and reports 200 leads at $50. The other counts only registrants who passed a fit check, finds 40, and reports $250. Same campaign, same spend, five times the cost per lead. The cheaper figure describes a looser filter, not a better campaign.
It runs the other way at the sales end too. One vendor published a customer's numbers on this: Alt21 reported a close rate "around 0.2%" from content leads against "nearly 20%" from direct inbound enquiries. Those are the source's own approximations, from one company, published by a vendor. Cohort sizes, period and the definition of a close are not given. Read it as a reason to check your own two rates separately, not as a ratio to carry anywhere.
Build your own B2B cost per lead before comparing
A benchmark you cannot reproduce is trivia. Four decisions turn cost per lead into something you can act on, and all four are yours to make.
Say you want the breakeven arithmetic and the lead-quality scoring that make your comparison fair. The B2B playbook in the ads skill carries both.
The B2B landing page defines what a form submission means before lead scoring begins.
-
Write the lead test
Which form, which fields, and what has to be true about the company. Not a category name, a test. For example: a demo request, from a company with more than fifty staff, where the work email resolves to that company. If two people on your team would classify the same submission differently, the definition is not finished.
-
Fix the cost convention
Media spend is the easy part. Creative production, landing page work, the tools and the share of a salary that runs the programme are the parts commonly dropped. Whichever convention you pick, keep it fixed, because a number that changes definition halfway through a year cannot be compared to itself.
-
Set the window
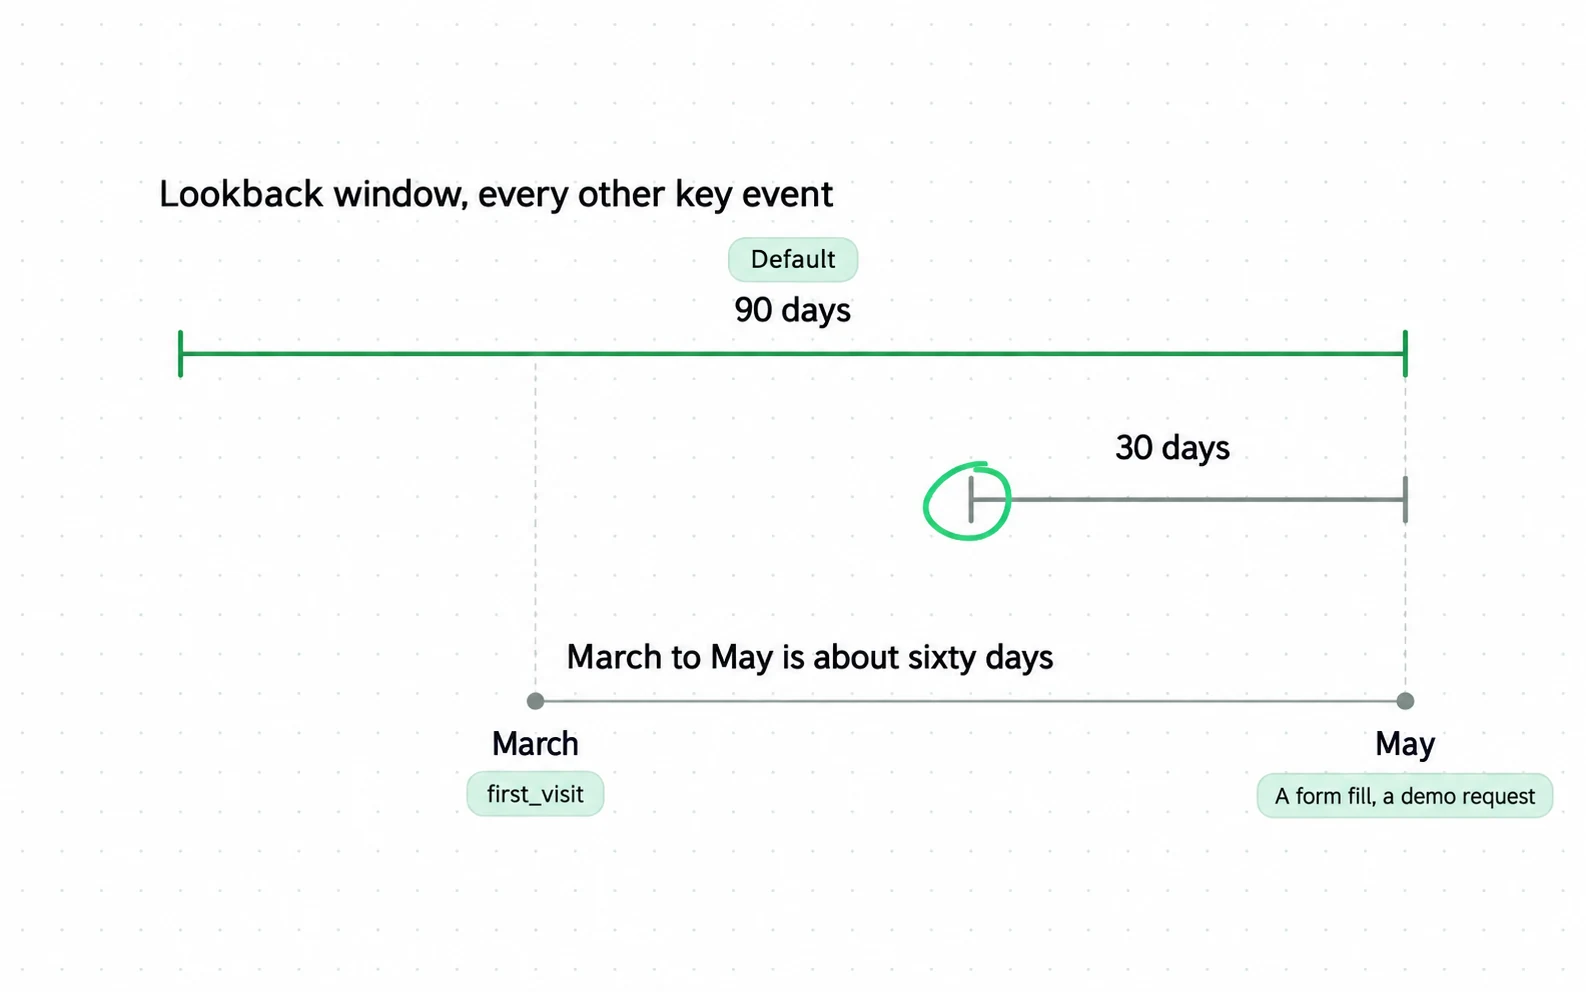
If somebody first arrives in March and fills in a form in May, which month carries the cost and which carries the lead? Decide before you need it, or every awkward case gets settled in the direction that flatters whichever channel someone is defending.
-
Split by channel
A blended figure hides the thing you would act on. LinkedIn costing more than search is only bad news if the leads convert at the same rate, and separating them is how you find out that they do not.
Only after those four are fixed does an outside benchmark become useful, and even then it works as a sanity check, not a target. For instance: your search cost per lead comes out at $400, and the publisher whose scope most closely matches yours prints something near $140. That gap is worth an afternoon. If yours lands at $150 instead, you have learned nothing, because you still do not know what they counted.
What B2B cost per lead does not decide
Everything above is about making the metric honest. This part is about how far an honest version of it carries you. Not as far as the attention it gets would suggest, and there is a better number waiting behind it.
Cost per lead is a cost, not an outcome. It answers what you paid for whatever you decided to count, and the Alt21 figures show how far that can sit from whether anyone buys.
A cost per lead is priced at the moment of capture, so it cannot know whether that lead qualified. The number worth watching sits one step down: what each channel costs once its leads have passed the qualification stage you defined. Both need a defined handoff between marketing and sales. Our guide to the difference between an MQL and an SQL covers where the line sits and who moves it.
A practical rule: publish the definition next to the number, every time. Three lines are enough. It takes a paragraph, and it separates a metric your board can question from one your board has to take on faith.
The three lines to publish next to any cost per lead figure
| Line | A worked example |
|---|---|
| What counted as a lead | A demo request from a company with more than fifty staff |
| Which costs were included | Media, creative, landing pages and tools; not salaries |
| Which window was used | Cost and lead both booked to the month of the form submission |
That paragraph is missing from every benchmark quoted on this page, and its absence is the whole reason a reader cannot use them to answer the question they came with.
Sources
- Forrester Transform Your Demand Process: the B2B Revenue Waterfall guide, which asks readers to "move beyond marketing-qualified leads (MQLs)" and describes "shifting from managing individual leads to identifying, prioritizing, and advancing opportunities with connected buying groups"
- Migao Wu, Pavel Andreev and Morad Benyoucef, Information Technology and Management The state of lead scoring models and their impact on sales performance, 2023, DOI 10.1007/s10799-023-00388-w: a systematic review of 44 studies published between 2005 and 2022 across six databases
- Zendesk What is B2B lead generation? Definition plus a three step process, and seven statistics borrowed from aggregator sites
- Cognism What is B2B Lead Generation? Definition page, which also says the process is known as demand generation
- Cognism Demand Generation vs Lead Generation: publishes a customer close rate of around 0.2 percent from content leads against nearly 20 percent from direct enquiries
- FirstPageSage Average Cost Per Lead by Industry: thirty industries, paid and organic, data collected January 2022 through June 2025, last updated 8 May 2025
- GrowthSpree B2B SaaS Cost per Lead Benchmarks 2026: channel quartiles from organic social to enterprise account based marketing
- OpGen Media CPL Benchmarks B2B 2026: channel ranges, pricing webinars per registrant and content syndication per verified qualified lead in the same table
- ConversionStudio Cost Per Lead Benchmarks: channel averages, plus the sentence naming which costs count and which leads qualify
- LocaliQ with WordStream Search Advertising Benchmarks: overall cost per lead of $66.69 across more than twenty industries, from thousands of its own customers campaigns
- Google Ads Help About lead form assets: describes the contact information a form collects, without defining what makes a submission countable
- HubSpot blog Demand generation vs lead generation: definitions of both, citing the 2025 Demand Generation Benchmark Survey
- HubSpot Marketing statistics: discloses a headline sample of more than 3,400 marketers for its 2026 report
- INFUSE What Is Demand Generation: says lead generation is the outcome of successful demand generation, and cites four statistics to four other publishers
- Demand Gen Report 2025 Demand Generation Benchmark Survey: the primary behind HubSpot attribution, published July 2025, full report behind a form
Questions people ask
What is a good cost per lead for B2B?
No single answer exists, and the published benchmarks cannot supply one: four different scopes, an average, a median, two ranges, and no sample size anywhere.
A useful comparison needs your own definition first: what counts as a lead, which costs are included, and over what window.
Is B2B lead generation the same as demand generation?
Publishers disagree, and the disagreement is not small. One definition page says the process of B2B lead generation "is also known as demand generation." Another says lead generation "is the outcome of successful demand generation." HubSpot describes them as separate and complementary. The comparison is a subject of its own, and the evidence each side leans on is examined in B2B demand generation.
What counts as a lead?
The widest definition in common use is the encyclopedia's: contact details plus interest. Google Ads documentation describes what a lead form collects without saying what makes a submission countable, and LinkedIn's guide skips the definition entirely. In practice the definition is yours to write, and writing it is the first real step.
Why do published cost per lead figures differ so much?
Because they are not measuring the same thing: different scope, different statistics, different units, and different cost conventions. Including creative, landing pages and tools raises the reported figure by 35 to 60 percent, on a figure one report attributes to HubSpot.

