

Why a fixed journey can mislead
Gartner's framework uses buying jobs that teams may complete in different orders, so a fixed sequence of stages does not describe how a deal moves. Record each job separately so the account record shows all the work the buying group is doing at once.
Today's B2B buying journey follows a nonlinear purchasing path that more closely resembles a set of distinct buying jobs or sets of tasks that buyers must complete to finalize an actual purchase. Most buyers revisit at least one buying job during their purchase journey.
Gartner, The B2B Buying Journey, FAQ, read 5 September 2026
Gartner names four buying jobs: problem identification, solution exploration, requirements building and supplier selection.
Say you sell to a company where the IT lead writes requirements while finance is still exploring other options. A single stage field can record only one of those jobs.
Keep a stage only when moving past it changes who owns the account, what you send or what you measure. Log the event that triggered each stage change so the team can see why the account moved.

Start with a small number of stages. Split a stage only when it groups buying tasks that need different owners or different follow-up.
Choose buying jobs before choosing a count
Start by tracking Gartner's four buying jobs. Add validation and consensus creation as separate jobs only when each one has its own observable event and a person on your side who responds to it.
Four core jobs and two optional jobs
| Core model | Optional extension | |
|---|---|---|
| Problem identification | yes | yes |
| Solution exploration | yes | yes |
| Requirements building | yes | yes |
| Supplier selection | yes | yes |
| Validation | no | yes |
| Consensus creation | no | yes |
Track validation and consensus separately only when each one changes an owner or action.
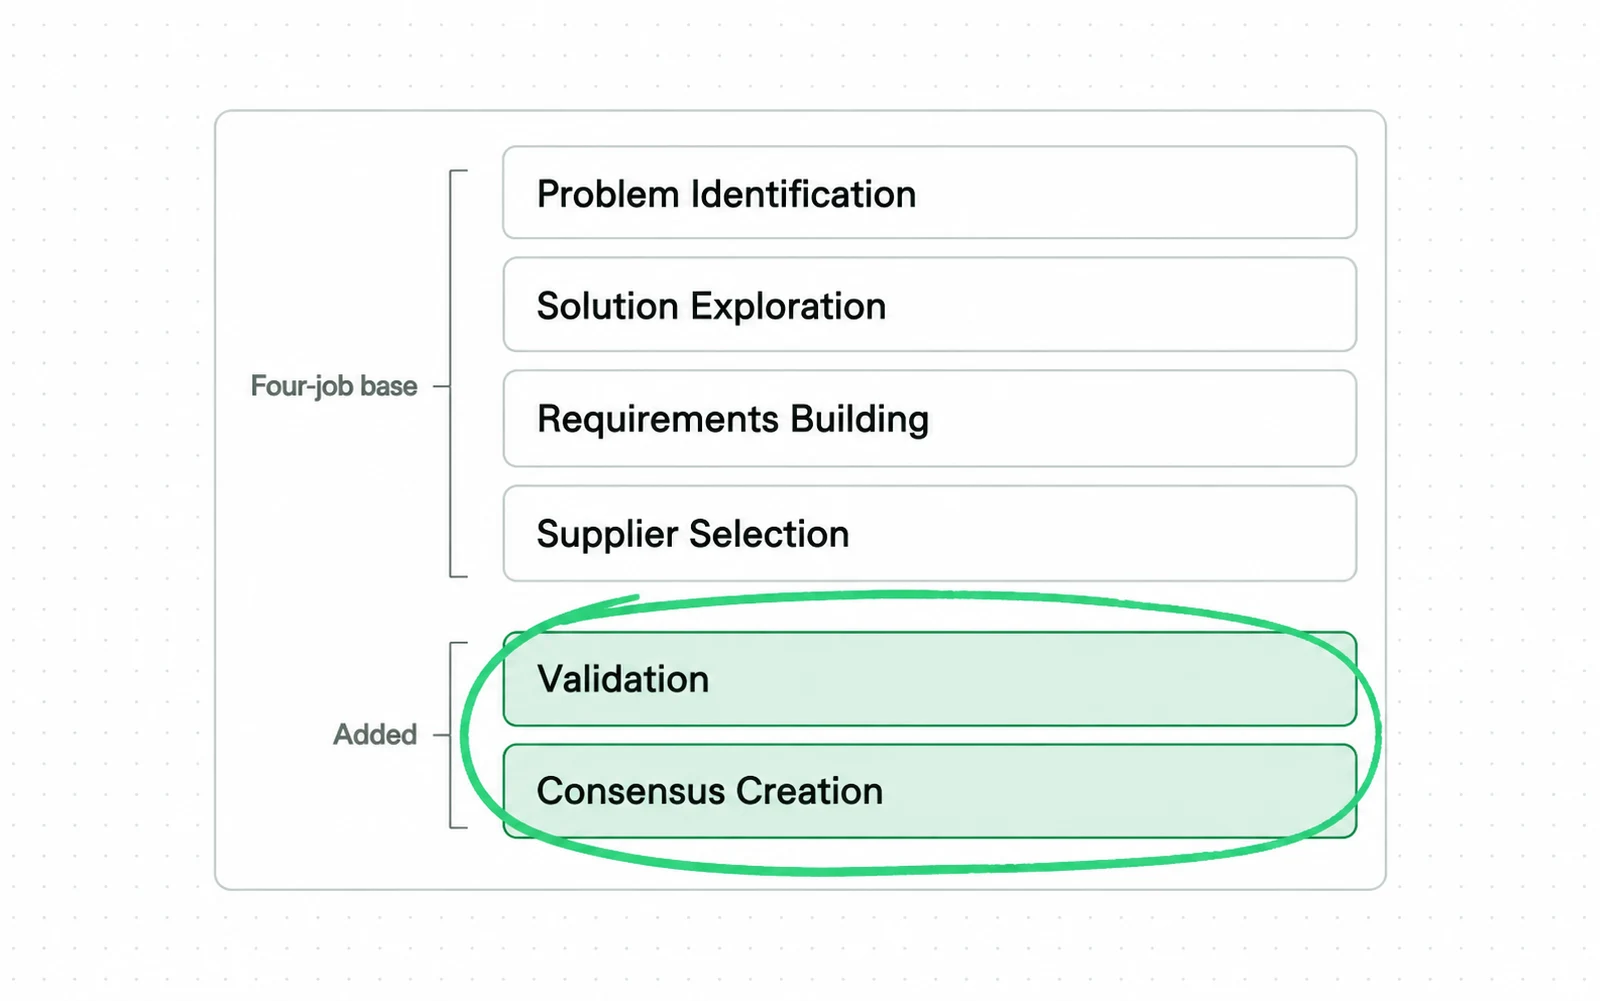
- Problem identification, solution exploration, requirements building and supplier selection appear in Gartner's FAQ and on growthmethod.com.
- Validation and consensus creation appear only in the growthmethod.com version. Each one needs its own event if you keep it.
- Growthmethod.com credits its six-stage version to Gartner. Gartner's own FAQ lists four categories.
Look at your recent lost deals before you add either job. Ask whether a missing security review or a missing internal agreement caused the loss. If neither shows up, keep the four core jobs.
For example, a security review request can mark validation when your team can confirm who requested it and why.
Buyers do not submit a form to signal consensus, so watch for new people joining the buying group. For instance, a meeting invite that adds a finance or legal contact to the deal is an event you can log.
Keep requests for documents separate from requests for a review. A buyer who downloads your security overview is still exploring. A buyer who sends you a security questionnaire has started validation.
Remove any job flag that no one uses to decide what to do next. It adds reporting work without improving the handoff.
For each buyer interaction on a channel you control, record the channel, the buying job it relates to and the date.
Tracking jobs instead of stages
If buyers work on tasks concurrently, replace the single progress field with one flag per buying job. Keep one stage field that shows which team owns the account today, marketing or sales.
Estimate how many of your accounts are looking to buy right now. John Dawes's 2021 95:5 Rule for the Ehrenberg-Bass Institute estimates that about 20 percent of B2B buyers are in market over a year and about 5 percent in a quarter.
If you serve a fixed list of accounts, apply the quarterly estimate to that list. It tells you roughly how many accounts to watch closely this quarter.
Let logged events decide which accounts get active follow-up. Keep the estimate out of the job flags, because a market-wide average says nothing about one account's intent.
Keep the flags on one account record that both marketing and sales can update. Show the latest event and its date on each flag so the next person can see why it changed.
Before you create the CRM fields, define them in a shared field dictionary. It holds every rule about events, owners and resets, so the rest of your process can point to it.
Give every job flag three values. Not started means no accepted event yet. Underway means the first accepted event is logged. Complete means the completion event is logged.
For each flag, the dictionary names the event that moves it to underway and the event that moves it to complete. It also lists events that do not count, the owner and the reset rule.
Requirements building, underway: the buyer shares a list of needs or asks for a requirements call. Complete: the buyer sends a signed-off requirements brief or an RFP.
Does not count: a visit to your pricing page. Owner: the account executive. Reset rule: move the flag back to underway when the buyer sends a revised brief.
Supplier selection, underway: the buyer asks for a reference call or a proposal. Complete: the buyer sends a contract for review or tells you that you are the chosen supplier.
For validation, a security review request moves the flag to underway. A visit to your security page does not count. Write an entry like this for each of your job flags.
-
List the buying jobs
-
Write the events that move each job
-
Give each job its own flag
-
Keep one stage field for the handoff only
-
Review the jobs that stall
What buyer journey tracking costs
Budget for three costs: CRM licences, staff time to write the field dictionary and any intent data you purchase. List each one on its own line. A software quote covers the licence only, so the staff time to define and maintain the flags needs a line of its own.
On 5 September 2026, HubSpot listed Marketing Hub Professional from $800 a month with 2,000 marketing contacts and a $3,000 onboarding fee. HubSpot listed Enterprise from $3,600 a month. On the same date, Salesforce listed Sales Cloud from $25 to $550 per user each month when billed annually. Prices move, so check both pages yourself before you commit a budget.
All of those plans include the custom fields you need for the flags. Start with the smallest plan that holds your flags and the reports your team already runs.
Budget separately for writing the field dictionary. Whoever does it needs to know your deals as well as your CRM.
Put the setup and running costs of tracking buying jobs in one spreadsheet. For each job flag, list setup time, its data source, owner review time and any vendor fee.
Add the hours for the first workshop with sales and operations to the spreadsheet. Then add the time for a recurring monthly review of the flags.
Intent-data pricing requires a vendor quote. Ask each vendor to price the same account list, signal set and retention period.
For example, the requirements building flag needs one CRM field and the two events from its dictionary entry. Its data source is your own CRM, so it carries no vendor fee.
How does a buyer map go stale?
Every flag in your CRM rests on a map of buying jobs and stages that goes stale unless someone checks it against recent deals. At each review, choose a stage transition you have not yet checked against recent deals. Write the name of the person who checked it next to the result.
Check any assumed sequence of stages against recent deals before you build reports on it.
For example, if your map says buyers compare vendors in week three, ask two reps when the last three deals did it. Update the map when their answers differ from it.
Check these eight parts of the map at each review.
| Map check | Evidence to store | Owner action |
|---|---|---|
| Boundary | Observable event that starts or ends the stage | Update it when deal evidence changes |
| Job signal | Event that moves a job to underway | Check false positives with account owners |
| Job completion | Event that moves a job to complete | Move the flag back to underway when buyers revisit the job |
| Handoff | Record of sales accepting the handoff | Review rejected handoffs with sales |
| Unseen research | Sources buyers say they used before contacting you | Compare them with the online interactions you recorded |
| Buying group | Roles and departments involved in the deal | Find missing roles before the deal stalls |
| Self-service | Preference for buying without a sales rep and any regret after purchase | Use reports of buyer regret to decide when to offer help from a sales rep |
| Review date | Recent deals checked against the map | Name the person who updates the model |
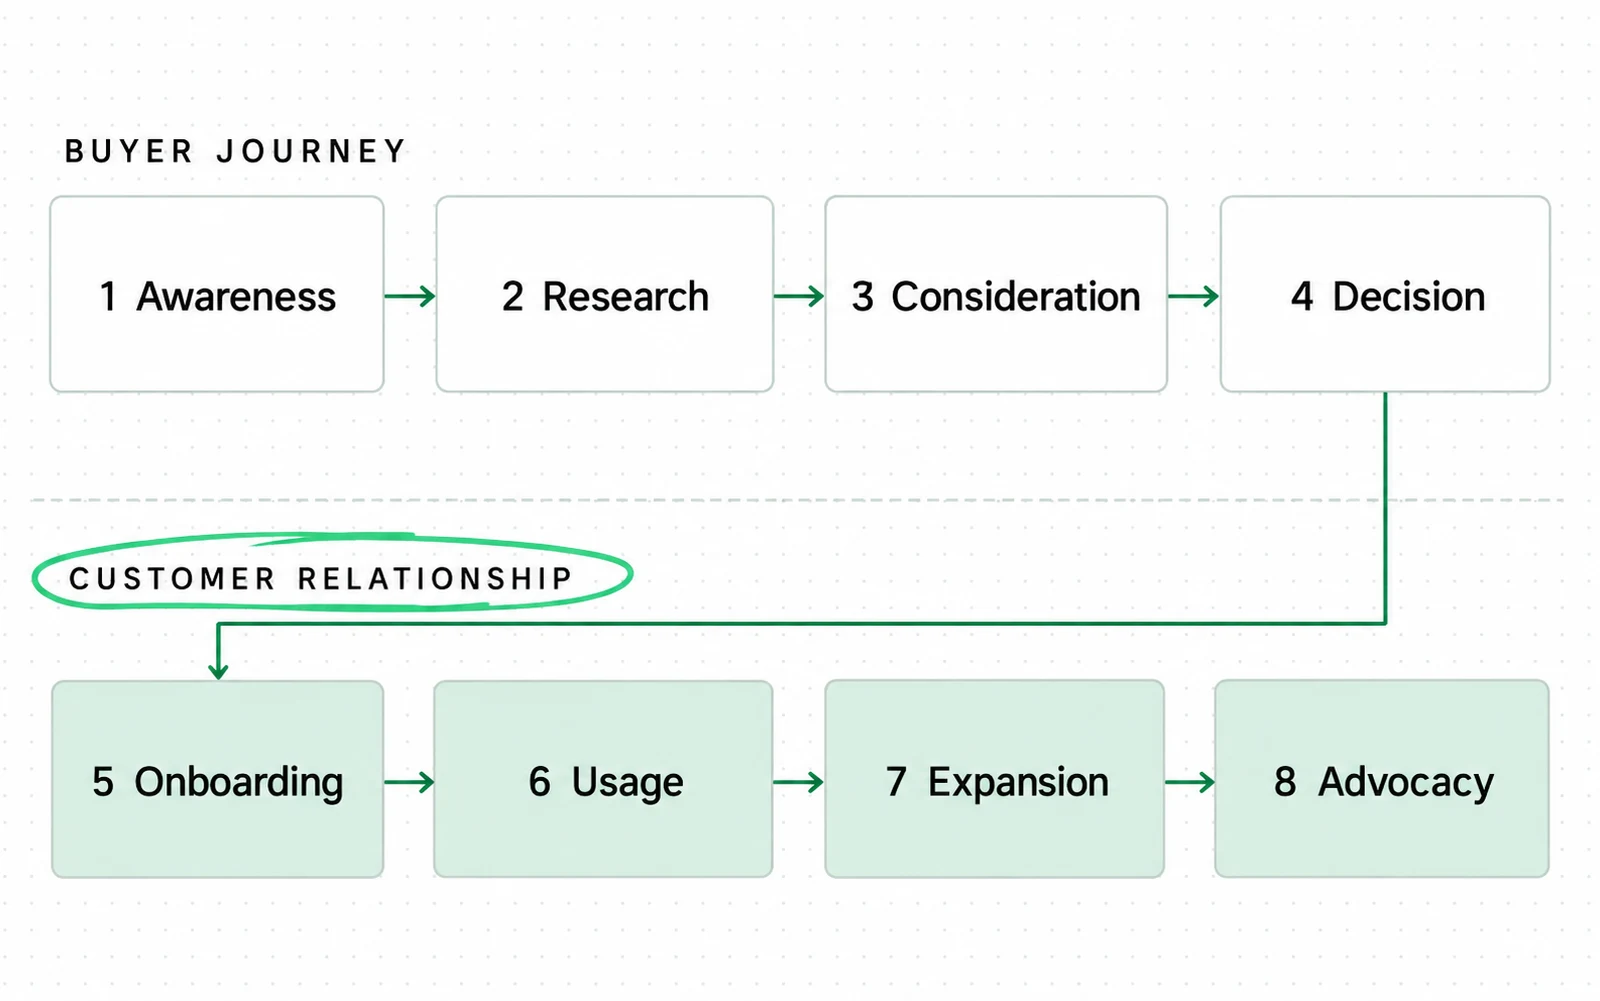
- A numbered list asserts an order that your buyer data must validate against real deals.
- Onboarding, usage, expansion and advocacy sit after the purchase, so this list combines the buyer journey with the customer relationship and needs two owners.
- Keep the first four stages for the buyer journey. Move the last four into your customer success plan.
To test a transition, review recent deals that have passed it and deals that have not. Ask the account owners what changed. Record any false positives.
Remove a transition that keeps failing the test. Merge the two stages on either side of it into one.
Do not build the map only from what your team can see. 6sense's 2024 survey of 2,509 B2B buyers found that 69 percent of the purchase process happens before sellers are involved.
Ask new customers during onboarding which sources they used before they first contacted you. Add their answers to the unseen research row of your map.
Part of that early research happens in search results. If search is the part of the journey you want to invest in, our B2B SEO service covers that channel.

Gartner reports that 75 percent of B2B buyers prefer rep-free sales, so make human help easy to request at every stage. Gartner also links digital-only purchases with higher regret.
Measure stalls and sales acceptance under any stage labels
Track three outcomes that work across different stage labels: stall rate, sales acceptance and contacts per account. Before you compare stage-three conversion rates with another company, check that both models define stage three the same way.
In your CRM, mark an open opportunity as stalled when it has had no logged event for a set period based on your sales cycle. Calculate stall rate as stalled opportunities divided by all open opportunities.
Keep the threshold and the reporting window fixed across periods. If you change the threshold, recalculate earlier periods with the new one before you compare them.
Add a reason code that names the job still underway on each stalled account. Use the codes to separate timing delays from delays caused by a missing stakeholder.
For example, if most stalls sit on requirements building, your buyers may lack a document they can share inside their company. Send the account owner a requirements template to offer them.
Sales acceptance tells you whether sales agrees with marketing's read on an account. Calculate it as accepted handoffs divided by total handoffs.
Write the acceptance criteria together with sales. Ask sales to give a reason code for every rejected handoff. Review the rejections by account and buying job each month.
6sense's 2024 study of 2,509 buyers puts the average buying group at 11 people. Forrester's 2024 State of Business Buying says 13 people are involved in the average buying decision.
Compare those two group sizes with the number of contacts you hold for each open account. If you hold far fewer contacts than either figure, look for the missing roles before the deal stalls.
Forrester also says 89 percent of purchases involve two or more departments. So check for contacts outside the department that first reached out, such as finance, legal or IT.
Your contact count per closed deal is already in your CRM. Group closed deals by size. For each group, review both the contact count and the roles involved before the opportunity opened.
Watch for flags that move from complete back to underway. When buyers reopen a job you had marked complete, rewrite that completion event in the dictionary first.
Sources
- Forrester The State Of Business Buying, 2024, press release 4 December 2024: "On average, 13 people within an organization are involved in the buying decision, with 89% of purchases involving two or more departments." The release does not publish its sample
- Gartner The B2B Buying Journey: buying jobs fall within four categories, problem identification, solution exploration, requirements building and supplier selection, and take place without a consistent order or journey; best practice is to catalogue buying jobs instead of mapping a journey; 75 percent of B2B buyers prefer a rep-free sales experience
- growthmethod.com Gartner's 6-Stage Framework Explained: attributes six stages to Gartner including validation and consensus creation, updated 22 June 2026
- HubSpot blog Creating a B2B buyer journey map in 8 steps: eight sequential stages, no cited statistic on the page, updated 30 May 2025
- Qualtrics Understanding and mapping the B2B buyer journey: three stages, states the journey is often non-linear, 18 May 2021
- Highspot Aligning Sales With the B2B Buying Journey: three stages, and four attributed statistics including Forrester at 86 percent of purchases stalling, updated 24 June 2026
- INFUSE What is B2B Buyer Journey: five stages, buyers move between stages fluidly and revisit earlier stages, citing 6sense at 61 percent of research done before vendor contact, 28 July 2026
- The Mx Group The B2B Buyer Journey: three stages, citing McKinsey B2B Pulse 2024 on an average of 10 interaction channels, 20 August 2025
- deeto B2B Buyer Journey: four stages, citing 6sense on an average buying group of 11 people and Gartner on 17 percent of purchase time spent with suppliers, 5 June 2025
- 6sense The B2B Buyer Experience Report for 2024: 2,509 buyers surveyed, 69 percent of the purchase process happens before buyers engage sellers, 81 percent choose a preferred vendor before speaking with sales; the 2025 study surveyed over 4,000 buyers
- John Dawes, Ehrenberg-Bass Institute The 95:5 Rule, 2021: about 20 percent of business buyers are in the market over a year and something like 5 percent in a quarter, with the author calling the figure a heuristic
- Oracle What is lead scoring: consider your sales acceptance rate to be the barometer of your scoring program health
- First Page Sage B2B Conversion Rates By Industry: 1.1 percent visitor to conversion for B2B SaaS, from client data gathered January 2022 to August 2025
- HubSpot Marketing Hub pricing: Professional from $800 a month with a $3,000 onboarding fee, Enterprise from $3,600 a month
- Salesforce Sales Cloud pricing: Starter Suite $25 through Max $550 a user a month
Questions people ask
What are the 8 stages of the B2B buying process?
An eight-stage model can use awareness, research, consideration, decision, onboarding, usage, expansion and advocacy. Use it only if each boundary has a recorded event and an owner.
Gartner instead uses four unordered buying jobs.
What are the five stages of the buyer journey?
A five-stage model can use awareness, consideration, decision, implementation and evaluation.
Choose a stage model whose transitions match the events and handoffs you record. Before you build the dashboard, define the event that marks each transition and the person who records it.
What is the B2B customer journey?
The buyer journey ends at the purchase. The customer journey carries on into onboarding, usage and renewal. Any model that runs through advocacy crosses into the customer journey.
Separating the two journeys matters most for subscription businesses, which keep earning revenue after the first sale. Keep separate owners and metrics for each side.
What is the rule of 7 in B2B?
No validated B2B rule says a buyer needs a fixed number of exposures before acting. Do not use a contact count as a journey-stage threshold.