

What is lead scoring?
A lead score is a number attached to a person or a company that says how worth pursuing they look. It splits into two questions: whether these are the right people, and whether those people are showing the right level of interest.
The first is explicit scoring, built on data a prospect hands you: job title, industry, company size. The second is implicit scoring, built on behaviour: visits, downloads, replies. The two questions are independent, and most published models keep them on separate axes.
Gartner says the sequence you would score against is not there. Buying jobs happen without a consistent order, and most buyers revisit at least one, so a returning prospect reads as a fresh one to any score built on stages.
One vendor publishes a grid for combining them. Fit runs A to D, engagement runs 1 to 4, and A1 is the most qualified while D4 is the least. Sixteen cells, and each cell can carry its own follow-up rule.
HubSpot ships the same idea at a different resolution. Its lead scoring tool offers engagement scores, fit scores and combined scores, and the combined score grades on a three by three matrix from A1 to C3. Nine cells instead of sixteen.
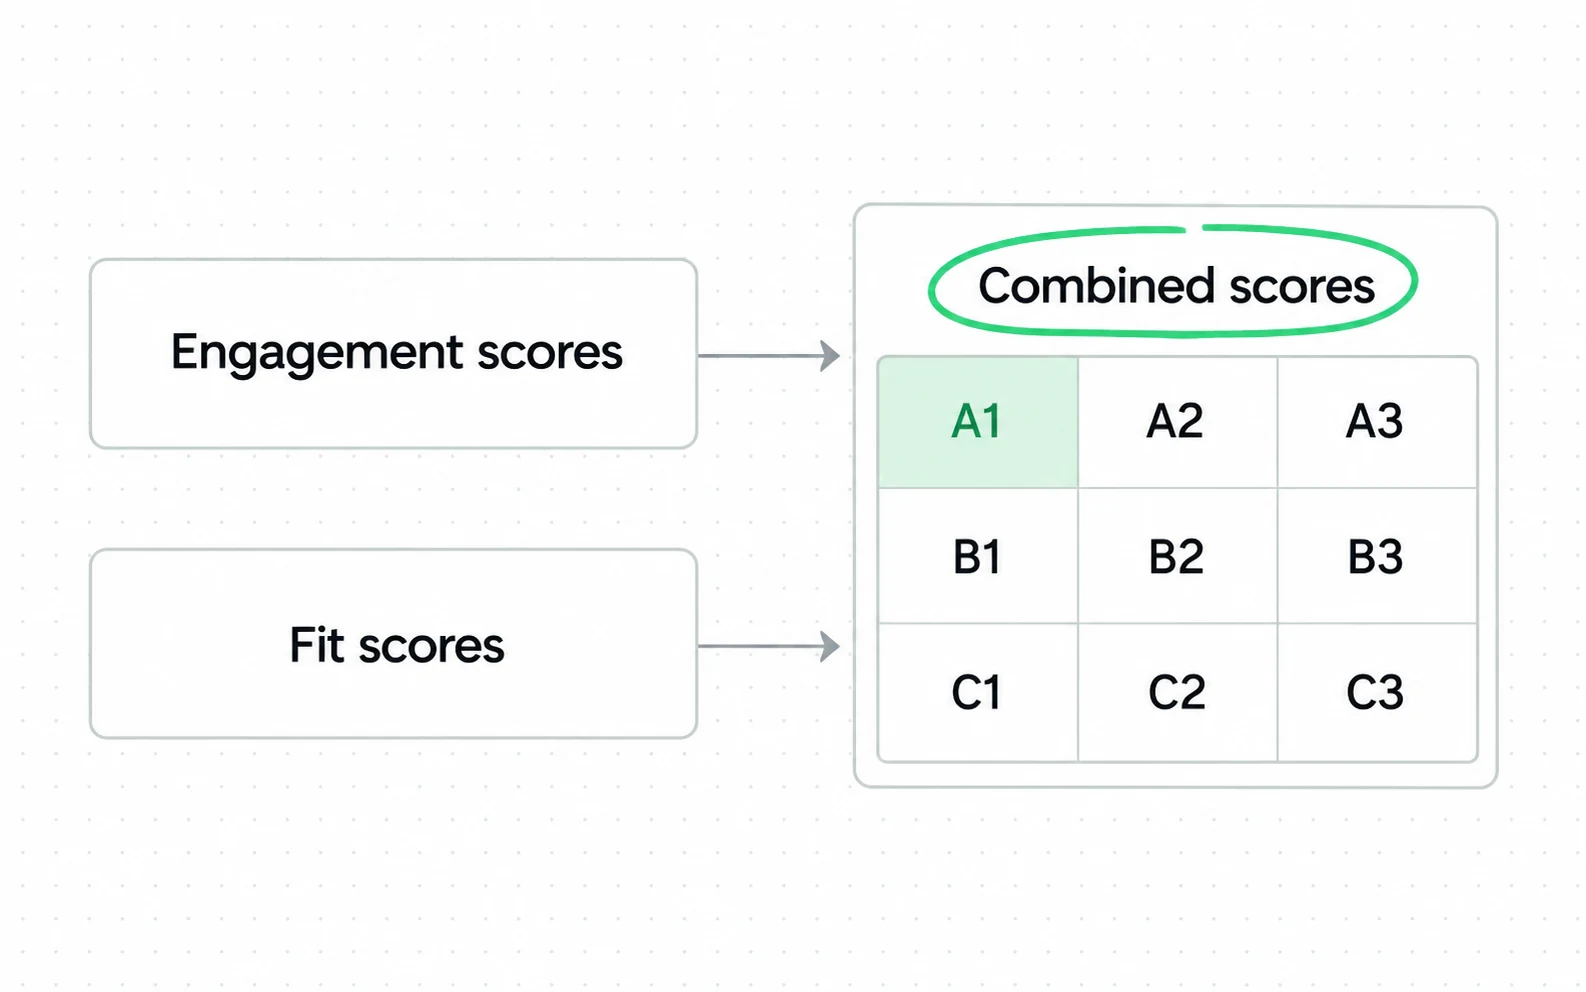
- Engagement and fit are separate score types, not two inputs to one number. A record can carry both.
- The combined score is where they meet, and it produces a letter and a digit instead of a total.
- A grade tells you which of the two halves is weak. A single total does not, which is the argument for keeping the axes apart.
Four named methodologies get you to a score: ideal customer profile, lamb or spam, rule-based, and predictive lead scoring. The first three are ways of choosing criteria by hand. The fourth learns them from outcomes, and it is a different animal.
The labels either side of the score are worth keeping straight. A score crossing a threshold is what usually produces a marketing qualified lead, and what happens after that is a separate decision covered in MQL vs SQL.
A published method that derives point values
Point values come two ways: assigned, or derived from what closed. Assigned values are the common form, and derived values are rare. That gap is easy to miss, because a table of invented points and a table of derived points look equally confident.
Salesforce publishes the derivation in four steps. Work out your baseline conversion rate. Define the ideal customer. Calculate the close rate for each attribute. Assign points to attributes whose close rate beats the baseline.
The worked example on its page: 100 customers from 200 leads gives a 50 percent baseline. Leads who watched a webinar close at 75 percent, and leads with a CTO title close at 65 percent. Webinar attendance gets 25 points. CTO title gets 15 points.
Close rate by attribute, against the baseline
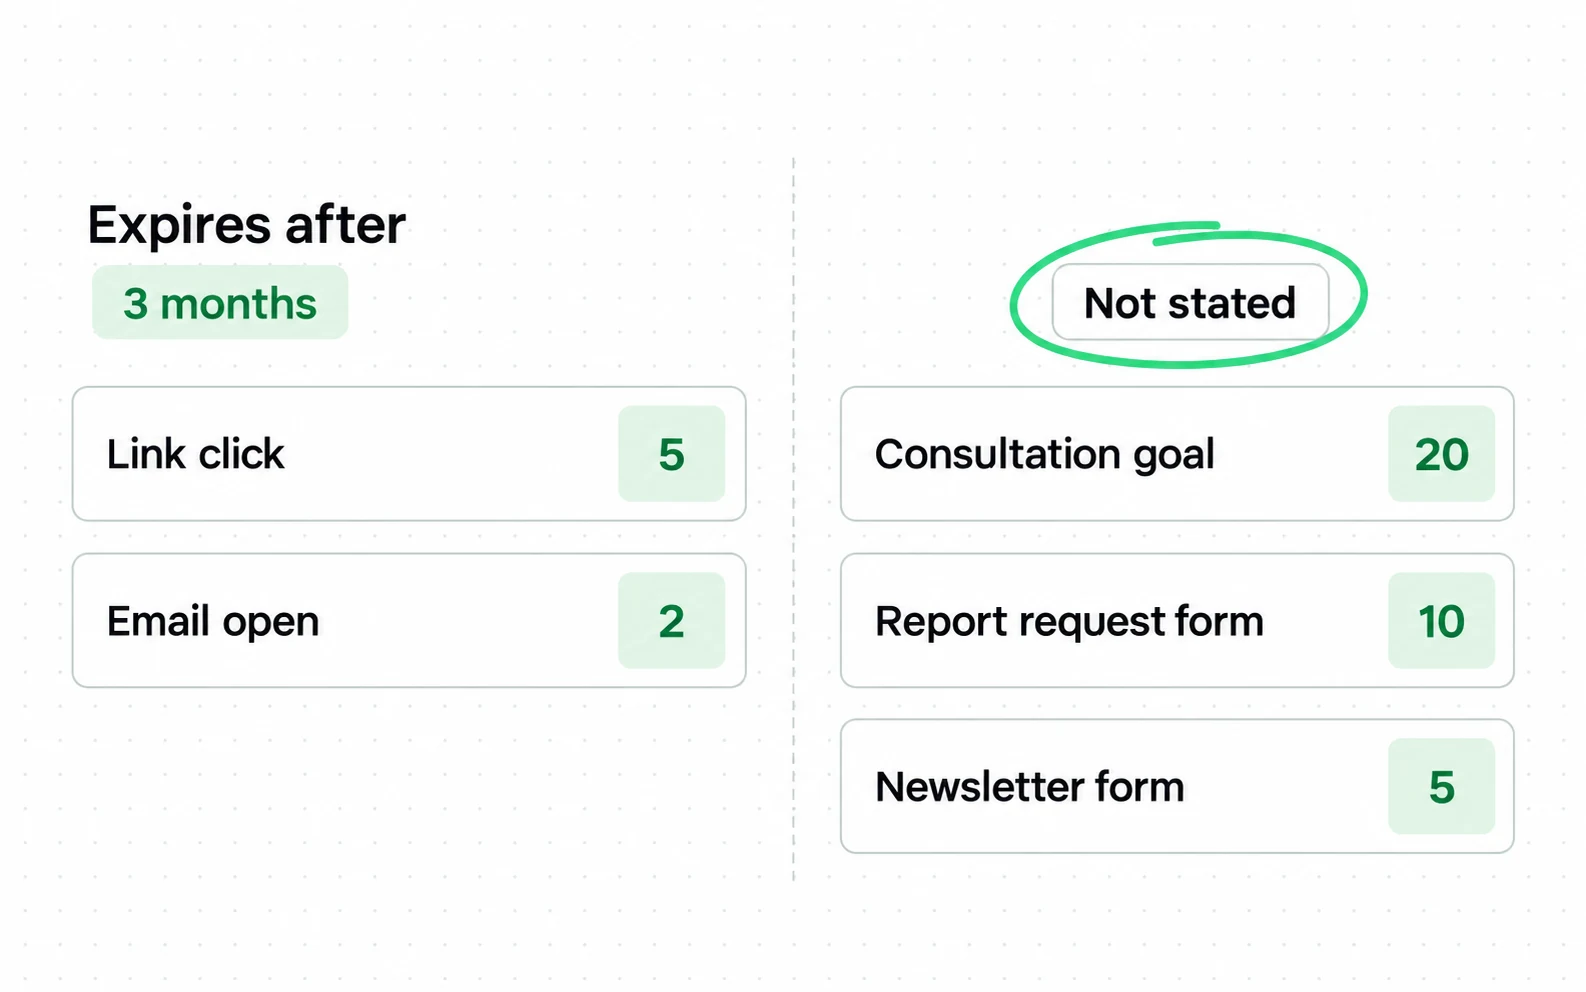
The other kind of page gives the numbers and skips the derivation. One platform puts a newsletter form at 5 points, a report request at 10, a consultation goal at 20, an email open at 2 and a link click at 5. Email opens and clicks expire after three months. A lead becomes sales-ready at a threshold, and the page gives 50 in one example and 300 in another.

Neither page is doing anything wrong. They are answering different questions: one shows a method, the other shows a shape. The problem is that a reader looking for numbers copies the second and gets a model with no evidence in it.
One of them writes out the part the rest leave implied.
It's up to you to determine your lead scoring model, i.e. how many points each action is worth, and at what scoring threshold you consider a lead to be marketing qualified.
Agile CRM, What is Lead Scoring, read 5 September 2026
What each method takes in and what it gives back
| Derived | Assigned | |
|---|---|---|
| Starting point | Baseline conversion rate | A list of actions |
| Rule | Points track the gap above baseline | Points reflect judged importance |
| What you need first | Closed-won history by attribute | An opinion about intent |
| Fails when | Volume is too low to compute close rates | The opinion is wrong and nothing says so |
| Published by | Salesforce | ActiveCampaign, Sponge, Agile CRM |
What an assigned model looks like in the wild is worth seeing, because the arbitrary part is not hidden. You can see it in the last row of the template.
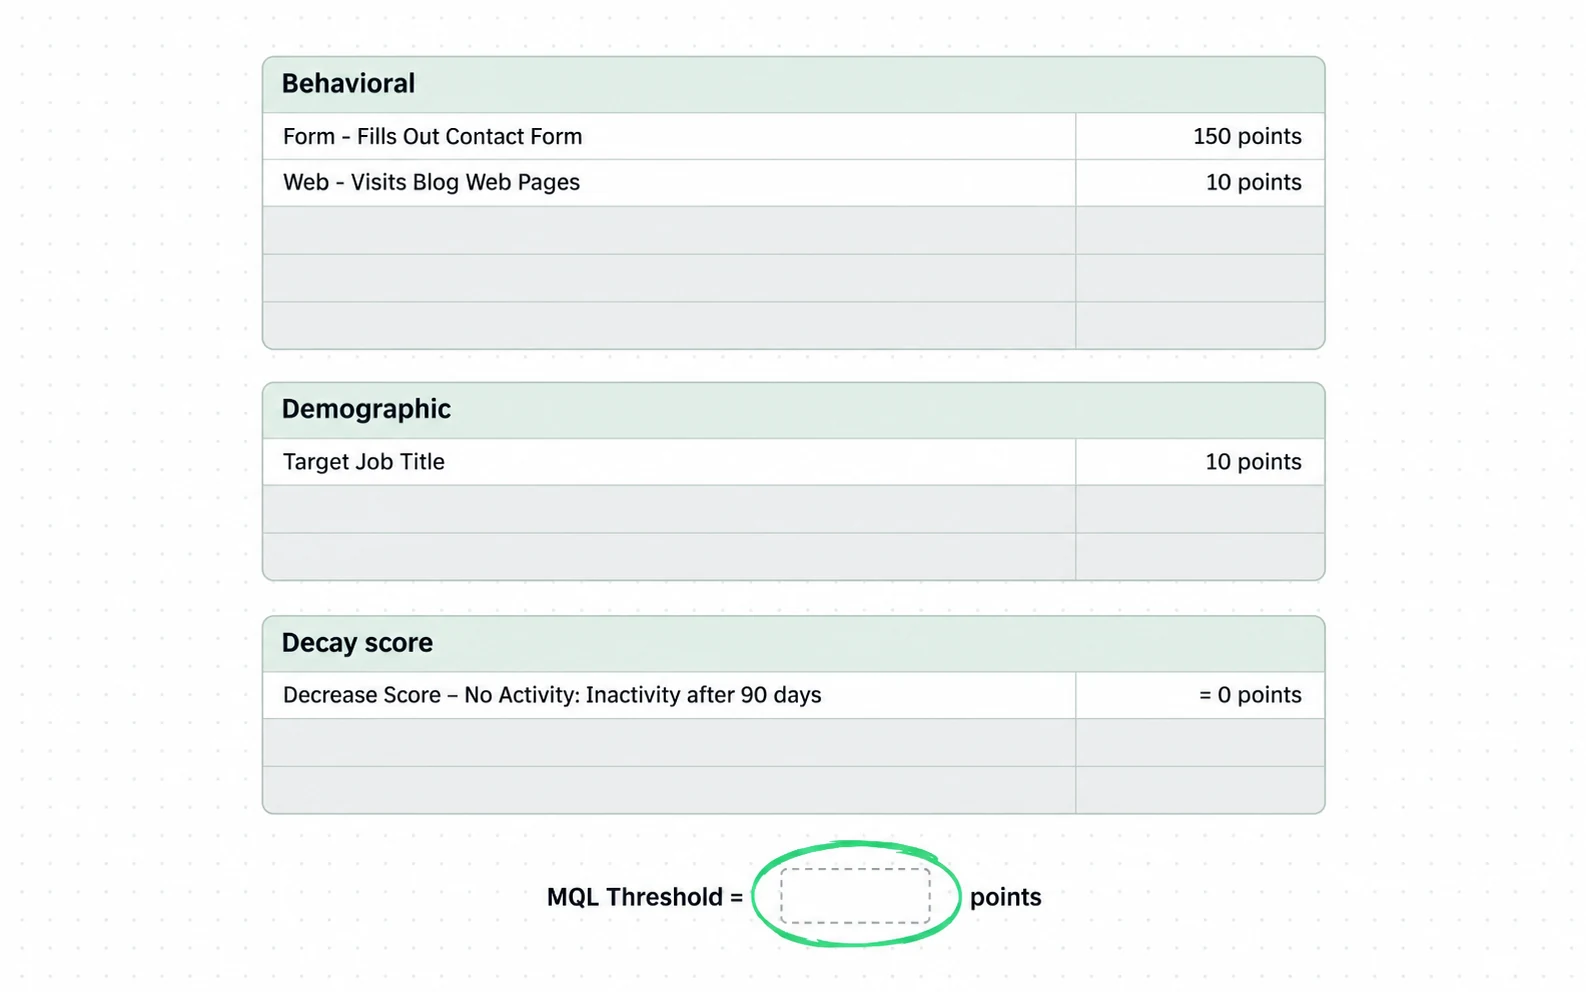
- Three score types, each with its own points table, and every value chosen, not measured.
- The decay table is the part most models skip, and it does real work: without it a five year old contact outranks a live one.
- The last line is the one that decides everything, and the template leaves it as xx.
Build a model from close rates
The derived method needs your closed-won history and nothing more exotic. If you have a few hundred closed deals with attributes attached, you can compute this in a spreadsheet. If you do not, use the assigned method and label your numbers as provisional.
-
Compute the baseline
-
Compute close rate per attribute
-
Keep the attributes that beat the baseline
-
Split fit from engagement before totalling
-
Set the threshold yourself, because no vendor sets it
-
Attach a follow-up rule to each grade
One consequence of step five deserves its own line. HubSpot documents that when a score is updated, property values and actions are re-evaluated retroactively. Change a rule today and yesterday's records get rescored, so a comparison across a rule change is not a comparison.
Step six needs somewhere to write its answer, and in most systems that place already exists. A score sits in its own property, and the handoff is a change to a different field: the lifecycle stage. Keeping them apart is what lets you ask how many scored leads went on to move.
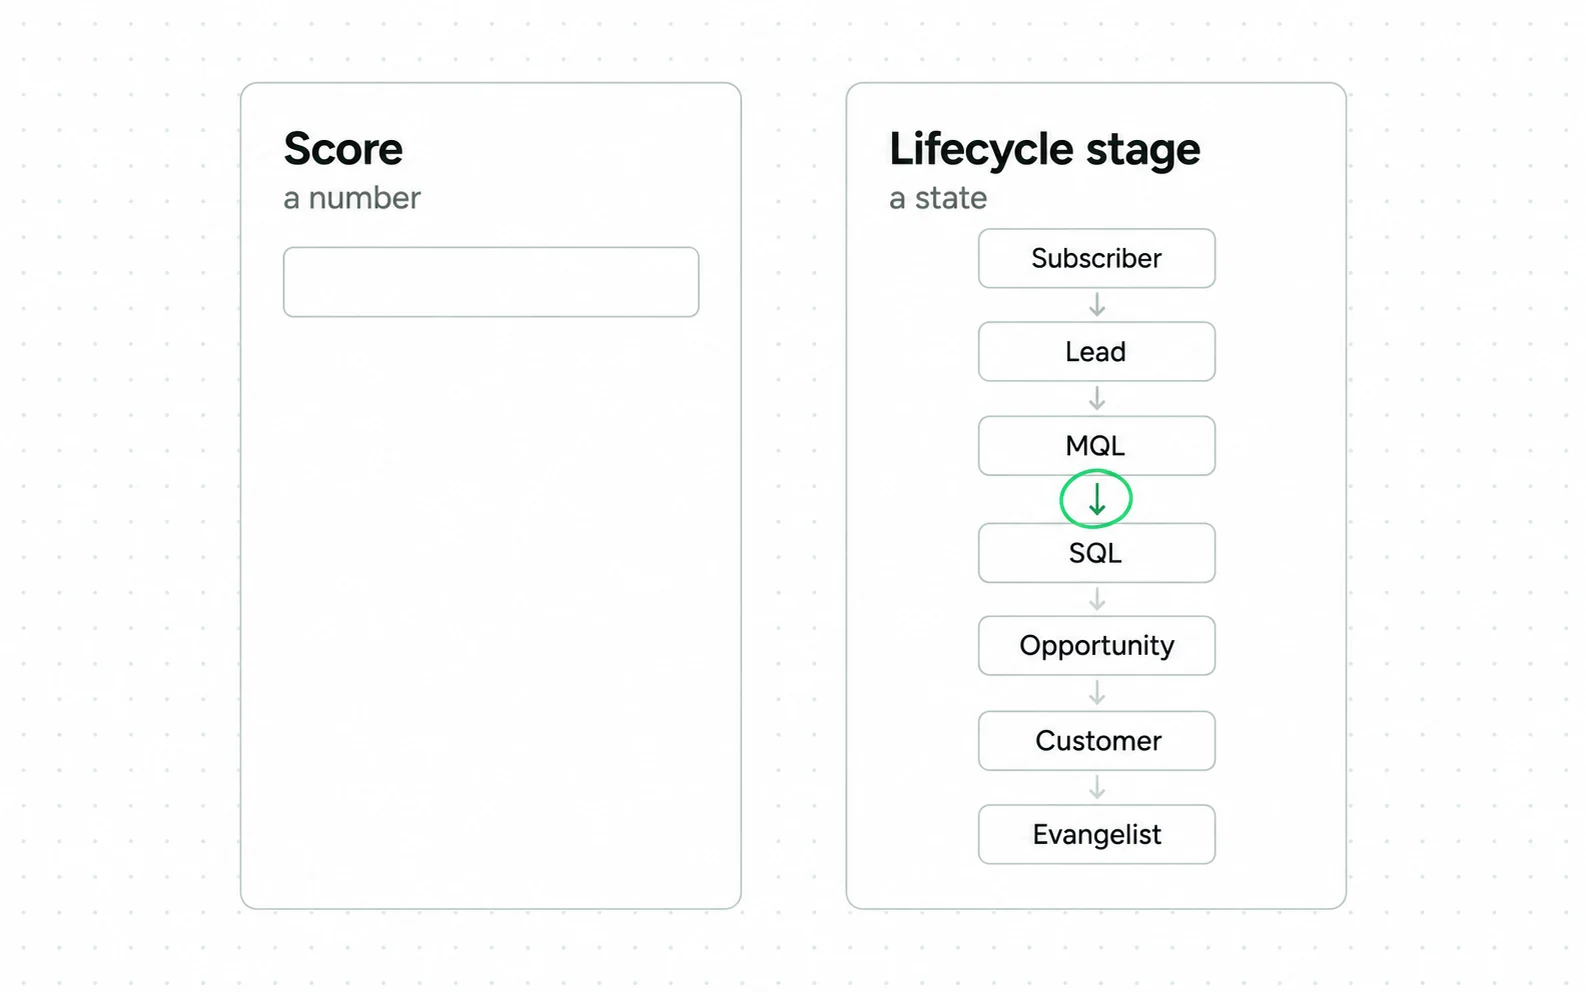
- The score is a number. The stage is a state, and only the stage change is an event another team can see.
- Marketing qualified lead and sales qualified lead are two of the default stages, so the boundary in the funnel already has a field waiting for it.
- A score that never moves a stage has produced no observable outcome, which is the cheapest test of whether a scoring programme is doing anything.
Which plan includes scoring?
Lead scoring is not usually bought on its own. It arrives inside a marketing automation or CRM licence, and the tier that includes it is higher than most people expect when they start planning.
HubSpot documents that contact, company and deal scoring sits in Marketing Hub Professional and Enterprise and Sales Hub Professional and Enterprise. AI-powered contact scores are Marketing Hub Enterprise only. Its published pricing puts Professional from $800 a month with 2,000 marketing contacts, plus a one time $3,000 onboarding fee. Enterprise starts at $3,600 a month with a $7,000 fee.
Salesforce publishes five Sales Cloud editions a user a month: Starter Suite $25, Pro Suite $100, Core $195, Advanced $395, Max $550. All are billed annually except Starter. Both vendors revise these figures.
So the practical floor for a scored pipeline on HubSpot is around $800 a month plus onboarding. The Starter tier that many teams begin on does not include scoring at all. A spreadsheet is a legitimate place for your scoring while the close rates are being computed, and it costs you nothing.
Predictive scoring has no public price. Sellers quote on request and no independent median is published, so there is no range here.
Suppose you want the demand feeding the score priced instead: that is the B2B PPC agency work at Addition, a search marketing agency.
Five ways a score stops meaning anything
Each of these is visible in published vendor material. A bad model is not a precondition for any of them, and they survive because the score keeps producing numbers the whole time.
Copying point values from a guide. Suppose you put a 20-point consultation goal straight into your model. You have imported someone else's guess about your buyers, and once it is a number in a field the guess becomes invisible.
Scoring the wrong half of the process. 6sense surveyed 2,509 B2B buyers in 2024. It found that 69 percent of the purchase process happens before buyers engage with sellers, and 81 percent choose a preferred vendor before speaking with sales. A behaviour score sees the last stretch of that and grades it as if it were the whole thing.
Leaving decay out. One published template includes a decay table and most models do not. Without decay, activity from two years ago counts the same as activity from Tuesday, and old records slowly float to the top of the queue.
Changing a rule and comparing across the change. HubSpot rescores retroactively, so the before and after of a threshold change are computed under different rules. Any improvement measured that way is partly an artefact.
Believing BANT still describes what buyers show you. Budget, authority, need and timeline are questions about a decision that has already started.
If you ask sales and marketing executives from 100 companies today how they score their leads, 99 of them will answer with the acronym BANT, that is, to qualify opportunities, a lead must have budget, authority, need, and timeline for purchase.
Oracle, What is lead scoring, read 5 September 2026
The objection is about sequence. Buyers gather information long before they have a budget or a timeline, and salespeople have no visibility into that period. A framework that requires four things a buyer has not decided yet will disqualify people who are going to buy.
Sales acceptance as the barometer
Your lead score is a prediction, so you can score it in turn. The trap is grading it on how many leads it produces. That measures where you set your threshold, not how good your model is.
The right test is your sales acceptance rate, the barometer of a scoring program's health. Acceptance is judged by the other team, and that makes it a real test instead of a self-assessment.
The second test is what accepted leads do afterwards, and the rate a score is trying to predict is MQL to SQL. First Page Sage publishes that by industry, from client data gathered between January 2022 and August 2025.
Peer-reviewed work exists on the predictive version, and its scope is narrower than the headline suggests. González-Flores, Rubiano-Moreno and Sosa-Gómez published a B2B lead scoring model in Frontiers in Artificial Intelligence in 2025. It was built on 23,154 records with 67 fields, from a single software company, covering January 2020 to April 2024.
What the peer-reviewed model reports
| Reported | |
|---|---|
| Records | 23,154, with 67 fields |
| Period | January 2020 to April 2024 |
| Companies in sample | One |
| Algorithms compared | 15 |
| Best model | Gradient Boosting Classifier |
| Accuracy | 0.9839 |
| ROC AUC | 0.9891 |
The authors state their own limit, and it is the limit that matters for anyone hoping to copy this. They write that the recent development of the scoring model limits the evaluation of the conversion rate of prospects into real customers qualified by the application. The model separates leads well. Whether the prioritised leads went on to buy is not yet measured.
A 2026 preprint by Zhang and colleagues names three problems in rule-based scorecards. Sparse supervision, a semantic gap in unstructured CRM logs, and an inability to capture relative lead priority. Its reported improvements are not quoted here, because the abstract states them without a denominator or a control definition.
That last problem is the one worth carrying away. A score answers how good a lead looks on its own. Sales works a queue, and a queue is a question about order. Those are different questions, and a threshold quietly converts one into the other.
Sources
- Migao Wu, Pavel Andreev and Morad Benyoucef, Information Technology and Management The state of lead scoring models and their impact on sales performance, 2023, DOI 10.1007/s10799-023-00388-w: a systematic review of 44 qualified studies published between 2005 and 2022, drawn from six databases, 39 of them peer-reviewed
- HubSpot Understand the lead scoring tool: engagement, fit and combined score types, an A1 to C3 combined matrix, overall and group limits, and the statement that when a score is updated property values and actions are re-evaluated retroactively
- Salesforce blog Lead Scoring: How to Find the Best Prospects in 4 Steps, 14 May 2025: baseline conversion rate, per attribute close rates, and a worked example giving 25 points to webinar attendance at a 75 percent close rate against a 50 percent baseline
- Oracle What is lead scoring: explicit and implicit scoring, an A to D by 1 to 4 grid with A1 most qualified and D4 least, an example service level agreement of 24 hours for A1 and B1, the BANT objection, and sales acceptance rate as the barometer of scoring health
- ActiveCampaign Lead Scoring 101, 17 March 2025: newsletter form 5 points, report request 10, consultation goal 20, email open 2 and link click 5, with opens and clicks expiring after three months
- Agile CRM What is Lead Scoring: states that it is up to you to determine how many points each action is worth and at what threshold a lead is marketing qualified
- Jessica Sprinkel, Sponge How to create a better lead scoring model: behavioral, demographic and decay score tables, with the MQL threshold left blank as xx points
- González-Flores, Rubiano-Moreno and Sosa-Gómez The relevance of lead prioritization: a B2B lead scoring model based on machine learning, Frontiers in Artificial Intelligence 8:1554325, 2025: 23,154 records with 67 fields from one software company between January 2020 and April 2024, 15 algorithms compared, Gradient Boosting Classifier at 0.9839 accuracy and 0.9891 ROC AUC
- Zhang, Liu, Sun, Zhang, Cao, Jiao and Qiao Rethinking Sales Lead Scoring with LLM-based Hierarchical Preference Ranking, arXiv:2606.04387, 3 June 2026: names sparse supervision, a semantic gap in unstructured CRM logs, and an inability to capture relative lead priority as the problems with rule-based scorecards
- 6sense 2024 B2B Buyer Experience Report: 2,509 buyers surveyed, 69 percent of the purchase process happens before buyers engage sellers, 81 percent choose a preferred vendor before speaking with sales
- First Page Sage B2B Conversion Rates By Industry: 1.1 percent visitor to conversion for B2B SaaS, from client data gathered January 2022 to August 2025
- Gartner The B2B Buying Journey: buying jobs take place without a consistent order or journey and most buyers revisit at least one
- HubSpot Marketing Hub pricing: Starter from $7 a month a seat, Professional from $800 a month with a $3,000 onboarding fee, Enterprise from $3,600 a month with a $7,000 onboarding fee
- Salesforce Sales Cloud pricing: Starter Suite $25, Pro Suite $100, Core $195, Advanced $395 and Max $550 a user a month
- Salesforce State of Sales State of Sales Report, cited on the Salesforce lead scoring page: reps spend 9 percent of their time researching prospects, 8 percent prospecting and 8 percent prioritising leads
Questions people ask
How to calculate lead score?
Derive it. Compute your baseline conversion rate, compute the close rate for each attribute, and assign points to attributes whose close rate beats the baseline.
Its worked example: 100 customers from 200 leads is a 50 percent baseline. Webinar attendees close at 75 percent and get 25 points. CTO titles close at 65 percent and get 15 points.
How does lead scoring work in a CRM?
The score lives in a property on the record, and rules add or subtract points when a property changes or an action happens. HubSpot documents overall limits, per group limits and per criterion values, which can be negative.
One behaviour catches people out. HubSpot re-evaluates records retroactively when a score is turned on or updated, so a rule change rewrites history instead of starting fresh.
What are the best lead scoring tools?
Scoring is a feature of the platform you already run, not usually a separate purchase. HubSpot gates it to Marketing Hub and Sales Hub Professional and above, with AI scores in Marketing Hub Enterprise only. The other major suites ship it inside a product you already pay for.
If your tier does not include it, a spreadsheet computing close rates by attribute is a reasonable first version, and it produces the evidence a tool would need anyway.
How to use AI for lead scoring?
Predictive scoring learns weights from your closed-won history instead of taking them from you. A 2025 paper in Frontiers in Artificial Intelligence compared 15 algorithms on 23,154 records from one software company and reported 0.9839 accuracy for a Gradient Boosting Classifier.
The same authors note the limit: whether the leads the model prioritised went on to convert was not yet evaluated. Separating leads well and improving revenue are two claims, and only the first was tested.

