

What is a SaaS marketing funnel?
Read three of the published models in a row and something strange happens by the third. Some models describe only the steps before the sale, and others describe only what happens after signup. Both are answering the same query.
The boundary between the marketing funnel and everything after it is rarely drawn at all. One definition draws that boundary explicitly, and it repays reading in full.
The SaaS product funnel is the customer journey that starts after someone signs up for your product, such as during a trial, and continues all the way through conversion, retention, and expansion. Essentially, the product funnel picks up where the traditional sales funnel ends, typically at purchase.
Jinwoo Park, Userflow, The SaaS Product Funnel, 7 May 2025
Once you have that sentence, the field sorts itself. Some publishers cover the span before purchase, some cover the span after signup, and three try to cover both in one list.
Which span each page covers
| Before purchase | After signup | |
|---|---|---|
| cloudshare | yes | no |
| mouseflow | yes | yes |
| rework | yes | yes |
| hockeystack | yes | yes |
| userflow | no | yes |
| userpilot | no | yes |
Three of them cover both spans in one list. Three cover one span only.
The counts differ too, and less interestingly: four, four, four, four, five and six. One model states its position outright and gives the mechanism in the same paragraph.
The six stage version adds activation, retention and expansion after conversion, calling the shape circular because subscription revenue compounds after the sale. That is a claim about payment timing, not about marketing, and it carries the whole argument for running past the purchase.
The stage model itself, the boxes and where they came from, is the same argument as in any other market. That argument is set out in the B2B marketing funnel. What is specific to SaaS is the endpoint.
Retention after purchase: SaaS Capital medians
SaaS pages keep running past the sale for a reason, and the reason is not fashion. Subscription revenue arrives again after the purchase, so a model that stops at the sale stops before the revenue has finished moving. How much it moves is measurable, and it varies by contract size.
SaaS Capital publishes retention medians by average contract value from its 2025 research, on a page dated 18 September 2025. Median net revenue retention runs from 98 percent for companies under $12,000 ACV to 106 percent for those above $250,000. Gross retention runs from 90 to 95 percent across the same six bands.
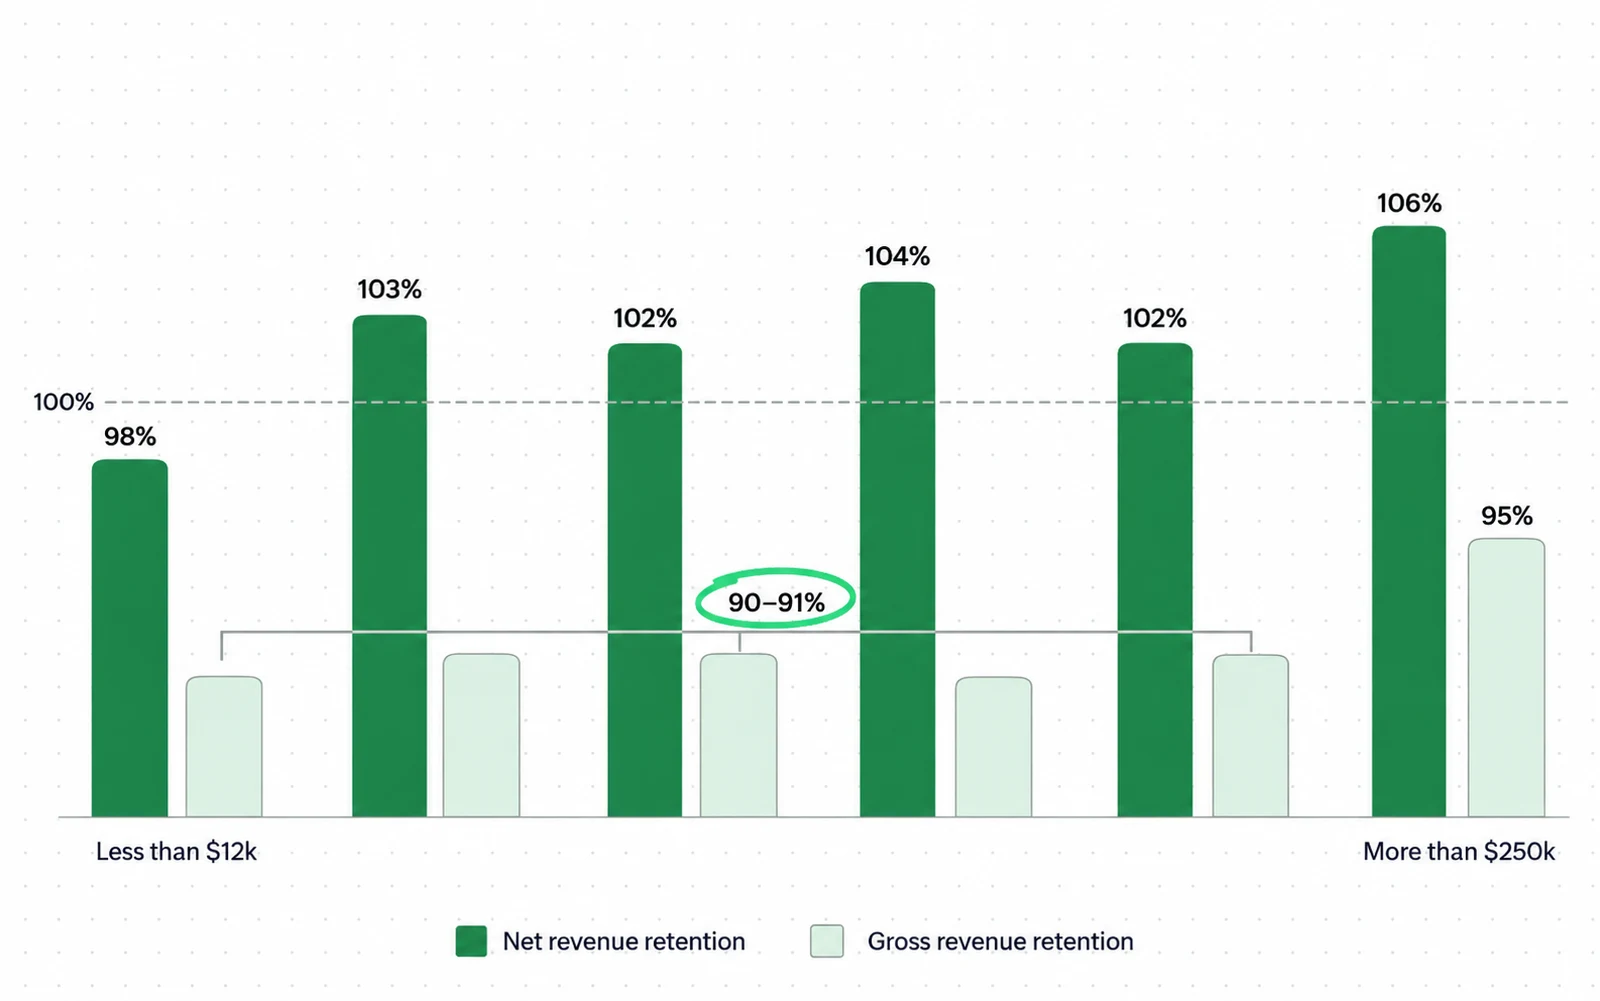
- Net retention is the blue series. Anything above 100 means existing customers paid more this year than last.
- The rise is not steady. It goes 98, 103, 102, 104, 102, 106, so the relationship holds at the ends and wobbles in between.
- Gross retention, the green series, sits at 90 or 91 percent in every band except the largest. Expansion is doing the work above 100, not lower churn.
The page draws its own conclusion from that chart, that higher net retention correlates with higher ACVs. Read the bars and the correlation holds at the two ends and not in the middle. That is a fair thing to notice about a chart doing otherwise honest work.
What this does not settle is where a funnel should end. A retention number cannot decide the boundary of a model, and reading it that way would be putting more weight on it than it carries. The boundary is a definitional question, and it should be stated explicitly wherever the funnel is drawn.
What the retention figures do settle is smaller and still useful. After the sale, revenue keeps moving, and the direction depends on contract size. Under $12,000 ACV the median company is losing revenue from its existing base. Above $250,000 it is growing without new logos.
Where each published model stops
| Page | Last named stage | What that covers |
|---|---|---|
| cloudshare | Converting | The purchase |
| mouseflow | Retention | Keeping the account |
| hockeystack | Advocacy | The customer referring others |
| rework | Expansion | The account spending more |
| userflow | Veteran users | Long tenure inside the product |
| userpilot | Used again | Repeat use of one feature |
How to choose an endpoint you can defend
The choice is not between four stages and six. The choice is whether your model covers one span or two, and who owns the second one. Getting this wrong shows up as a retention target with nobody attached to it.
-
Name the signup event
-
Decide whether marketing owns anything past it
-
Give the second span its own model and its own owner
-
Define activation before you measure it
-
Pick the retention band that matches your ACV
Forrester changes the unit rather than the endpoint. Its B2B Revenue Waterfall asks you to move beyond marketing-qualified leads and to advance opportunities with connected buying groups.
That does not choose your endpoint, and it does narrow the argument. For example, if the thing moving through your funnel is a group, an endpoint defined on one person’s signup is describing a fraction of the decision.
The lead qualification labels sit inside the first span and do not change in SaaS. Where the handoff falls and what each side calls a lead is covered in MQL vs SQL. A product signal can qualify a lead too, and that is a product qualified lead.
Published software prices for each span
Both spans need software, and the first is easier to price. Marketing automation and CRM publish rate cards. Analytics and onboarding tools for the second span publish less. Userpilot, for one, lists Starter at $299 a month and asks for a call on Enterprise.
On HubSpot the entry point is Marketing Hub Starter at $7 a seat a month billed monthly. Professional opens at $800 a month for 2,000 marketing contacts. Enterprise opens at $3,600. Onboarding is a one time $3,000 on Professional and $7,000 on Enterprise. Salesforce prices Sales Cloud per user per month, from $25 on Starter Suite to $550 on Max, with annual billing on the tiers above Starter.
HubSpot, Salesforce and Userpilot pricing pagesWhat each span costs to enter, where a price is published at all
Addition’s own panel. Every figure is the vendor’s published price: HubSpot and Salesforce read 5 September 2026 and unchanged on 7 October 2026, Userpilot read 7 October 2026.

Both vendors revise these figures. What they buy is the record of the first span: contacts, deals, stages, reporting.
The second span is harder to price. Userpilot’s starter price does not give a range for the category, and we did not compare the others, so this page quotes no range for it.
One thing worth noticing about the arithmetic: a six stage model and a four stage model cost the same to license. The expense in SaaS is not the diagram. The expense is that the second span needs a team who reads product behaviour, and that is a line most marketing budgets are not already carrying.
Suppose you want the top of your own funnel filled: that is our SaaS SEO service.
Four SaaS marketing funnel errors from a borrowed endpoint
Each of these starts the same way: a stage list copied from a guide whose endpoint does not match the business copying it. The list looks complete, so nobody checks what it covers.
Setting a retention target inside a marketing model. Suppose your model ends at expansion but your marketing team is measured on pipeline. The last two stages then have a target and no owner, so they get reported on every month and worked on never.
Treating the top of the funnel as a queue. The figure that circulates says 95 percent of a target audience is not in the market right now. The underlying work is John Dawes at the Ehrenberg-Bass Institute, and reading it directly beats reading a page that quotes it.

Quoting benchmark bands without a window. Trial to paid at 10 to 25 percent and activation at 25 to 40 percent circulate with no source and no date attached. Bands like these travel fast and mean nothing without a denominator, so they are named here and not used.
Confusing an adoption funnel with a marketing funnel. One published set of four stages describes a single feature: exposed, activated, used and used again. That is a useful model, and if you borrow it for acquisition you will be measuring one feature and calling it your funnel.
Net and gross retention: cohort and period
Two numbers matter in your second span and both are easy to compute wrongly. Net revenue retention compares a cohort against itself over time, so fix your cohort and your period before you read anything into it.
Net revenue retention compares the recurring revenue from one set of customers at the start of a period against the revenue from those same customers at the end. Upgrades, downgrades and churn count; new customers do not. SaaS Capital reports medians from 98 to 106 percent depending on contract value.
The loss underneath retention has its own vocabulary, and a SaaS churn rate means one thing when you count customers and another when you count revenue.
Gross retention leaves out the upgrades. Across the same six bands it sits between 90 and 95 percent, so it shows how much of the base holds without expansion covering for it. Every band except the largest lands at 90 or 91. Most of the spread between a 98 and a 106 comes from the base holding: gross retention moves five points across the bands, and expansion accounts for the other three.
The first span keeps its own number, and it is small. First Page Sage puts visitor to conversion at 1.1 percent for B2B SaaS, from client data gathered between January 2022 and August 2025. At that rate a hundred conversions takes roughly nine thousand visitors.
A vendor funnel guide quotes the same figure, and the citation holds up when you follow it back to First Page Sage.
Trial and freemium are not the same entry either, and the distinction usually gets blurred. A trial has an end date, so the decision arrives on a schedule you set. A freemium plan has no end date, so the decision arrives when the customer hits a limit, or never. The same activation rate means different things under each.
That difference lands directly on the first span. A trial gives marketing a deadline to work against. A freemium plan does not, and the work moves inside the product where marketing usually has no surface. Choosing between them is a funnel decision dressed up as a pricing decision.
Activation is the stage that never gets defined. Wherever it is named as a stage, the denominator and the window are left open. Until you write yours down, an activation rate is a number that moves when the definition moves, and nobody will be able to tell the two apart.
The same open definition problem sits in the layer above. For example, whether you can compare your retention number against anyone else's depends on which SaaS metrics feed which.
Sources
- Forrester Transform Your Demand Process: the B2B Revenue Waterfall guide, which asks readers to "move beyond marketing-qualified leads (MQLs)" and describes "shifting from managing individual leads to identifying, prioritizing, and advancing opportunities with connected buying groups"
- Jinwoo Park, Userflow The SaaS Product Funnel: the product funnel starts after someone signs up and picks up where the traditional sales funnel ends, typically at purchase; four stages from trial users to veteran users
- Rework SaaS Marketing Funnel: states the complete SaaS funnel has six stages, not four, running awareness, consideration, conversion, activation, retention and expansion; benchmark bands published without sources and the page carries no date
- Mouseflow Building a Winning B2B SaaS Marketing and Sales Funnel: four stages with retention inside the bottom of funnel, states the customer journey will not be linear, 11 April 2026
- HockeyStack An Ultimate Guide To SaaS Marketing Funnels: five stages ending at advocacy, no cited statistics on the page, 11 June 2025
- CloudShare SaaS sales funnel: four stages, raising interest, engaging potential buyers, bringing up value and converting, all of them before the sale; page carries no date
- Userpilot Adoption funnel: exposed, activated, used and used again, describing adoption of a single feature after signup, updated 18 August 2026
- SaaS Capital What is a Good Retention Rate for a Private SaaS Company: median net revenue retention across six ACV bands at 98, 103, 102, 104, 102 and 106 percent, with gross revenue retention at 90, 91, 91, 90, 91 and 95 percent, 18 September 2025
- John Dawes, Ehrenberg-Bass Institute The 95:5 Rule, 2021: firms change providers such as their principal bank or law firm about once every five years, so around 20 percent are in the market over a year and something like 5 percent in a quarter; the author states 95 percent is a heuristic and not a precise rule
- Akinori Iwamoto, Kansai University The Origin of AIDA: Who Invented and Formulated the AIDA model?, Proceedings of the Conference on Historical Analysis and Research in Marketing, volume 21, 26 June 2023, 18 pages
- First Page Sage B2B Conversion Rates By Industry: 1.1 percent visitor to conversion for B2B SaaS, from client data gathered January 2022 to August 2025, page updated 18 September 2025
- Twilio A Guide to B2B Marketing Funnels: cites First Page Sage at 1.1 percent for B2B SaaS, a citation that checks out against the source
- 6sense 2024 B2B Buyer Experience Report: 2,509 buyers surveyed, 69 percent of the purchase process happens before buyers engage sellers
- Gartner The B2B Buying Journey: buying jobs take place without a consistent order or journey
- Userpilot Pricing: Starter at $299 a month, Growth from $849 a month, Enterprise on request
- HubSpot Marketing Hub pricing: Starter from $7 a month a seat, Professional from $800 a month with a $3,000 onboarding fee, Enterprise from $3,600 a month with a $7,000 onboarding fee
- Salesforce Sales Cloud pricing: Starter Suite $25 through Max $550 a user a month, billed annually except Starter
Questions people ask
Is funnel marketing outdated?
The model is old. Its stages are usually dated to 1898, and the drawing itself is traced to William W. Townsend in 1924. The 1898 attribution is repeated in the reference entries most people reach first, and that is why you meet it everywhere. That attribution does not survive checking: Akinori Iwamoto of Kansai University found no writing by Lewis from that year and credits Frank H. Dukesmith and Arthur Frederick Sheldon.
Whether it is outdated depends on what you use it for. As a description of how buyers behave it is weak, and Gartner publishes that buying happens without a consistent order. As a record of who owns a deal at a given moment it still works, because that is a question with one answer at a time.
What are the 5 stages of the marketing funnel?
Five is one model's answer. Among the SaaS results the counts are four, four, four, four, five and six, and the five stage version runs awareness, consideration, decision, retention and advocacy.
The more useful question for SaaS is not how many stages but where yours ends, because that decides who owns retention.
How do you market a SaaS product?
The acquisition half is ordinary demand work: search, content, paid and email against a defined buyer. Nothing about it is unique to software.
What is different is that the sale is not the last payment. Net revenue retention above 100 percent means existing customers grew, and SaaS Capital reports medians running from 98 to 106 percent by contract size. Companies that ignore the second span leave that growth on the table.
How did Gen Z break the marketing funnel?
Nothing published on this measures a generational effect on funnel behaviour.
What is measured is that buyers do most of their work before contacting anyone. 6sense surveyed 2,509 B2B buyers in 2024 and found 69 percent of the purchase process happens before sellers are engaged. That describes purchase sequence, not a generational effect.