

How many metrics are there?
No standard set exists, and published lists run from five metrics to twenty-eight. The disagreement worth your attention sits underneath that count, where one name covers different quantities and nobody says which one they mean.
The counts themselves are easy to line up: twenty-two, twenty-eight, fifteen, thirteen, five. Google suggests a top five beside this term, so anyone answering picks a scope before picking a number.
The widest of them runs to twenty-two metrics under five headings. Its summary names twenty-one of them in one line per heading, and the twenty-second, Magic Number, appears only further down the page.
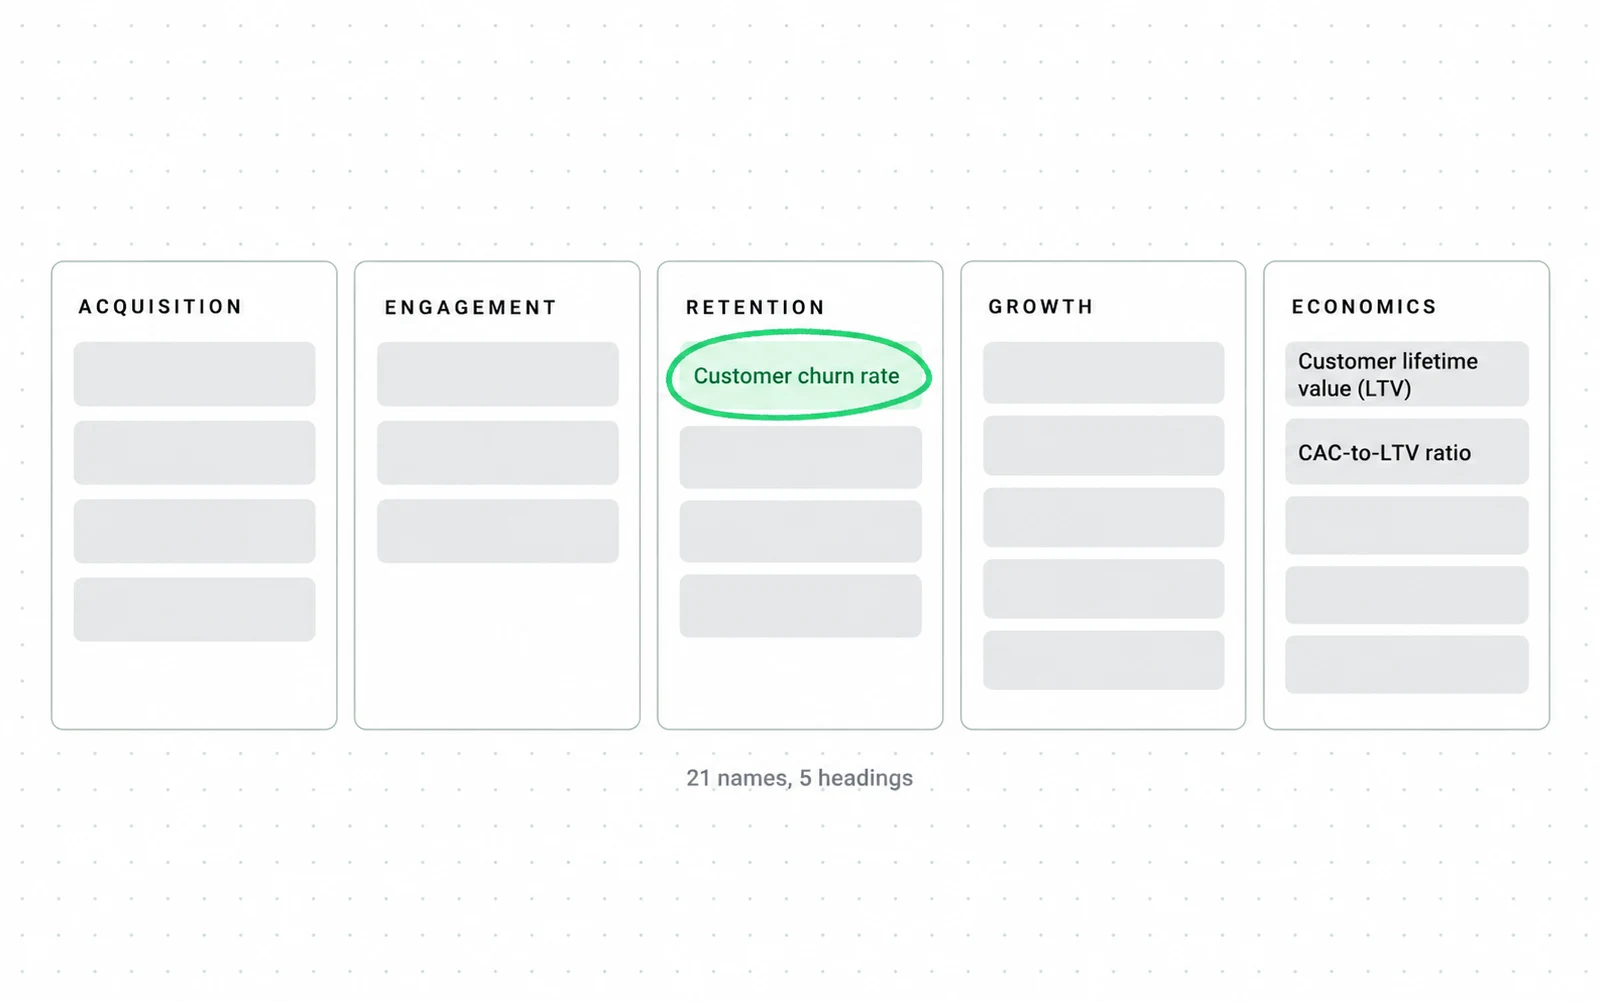
- Acquisition, engagement, retention, growth and economics. The headings sort the metrics, and the summary leaves them unconnected. The formulas come later, one section per metric.
- Lifetime value and the CAC-to-LTV ratio sit in the same line under economics. The arithmetic linking acquisition cost to lifetime value, CAC divided by LTV, is printed only further down the page.
- Customer churn rate sits two headings above lifetime value, and churn is a term in the most common lifetime value formula.
Sorting metrics into groups makes a long list readable. It also makes every entry look like a separate measurement, and several of the entries on this page are not.
What each list advertises, against how many metrics it goes on to name.
| Guide | What it advertises | What it names |
|---|---|---|
| Stripe | 22 metrics, in five categories | 22 |
| Maxio | 15 | 15 |
| NetSuite | 14, plus a shorter set of five | |
| Paddle | 10 | 28 |
| Sacks and Ruby | 6 categories, not a count | |
| The SaaS CFO | 5 pillars, not a count | |
| Growth Equity Interview Guide | No count | 15 |
| Breaking Into Wall Street | No count | 5 |
| Equals | No count | 13 |
Nine different answers is not a scandal. Different readers need different depth, and a five item framework for a finance team and a twenty-two item catalogue for a product team can both be right.
A venture firm put its own count in a title in 2015 and named the trouble in the same piece. People use different definitions of the same metric, and that makes the health of a business hard to read.
Which metrics are calculated from other metrics?
A flat inventory treats every metric as separate. A circuit shows how one changes another. Lifetime value is the clearest case: one published definition has it incorporate acquisition cost, dollar retention and gross margin. Three metrics from that same list are inputs to a fourth one on it.
The phrase that decides everything below sits three lines before his list, in the definition itself.
Lifetime Value (LTV) is the cumulative gross profit contribution, net of CAC, of the average customer in a cohort. Therefore, LTV incorporates CAC, Dollar Retention, and Gross Margin to show overall company health.
withgrid.com, The SaaS Metrics That Matter read 10 September 2026
- The definition says net of CAC. Acquisition cost is subtracted before the number is reported.
- The next sentence names the three things it incorporates, and Stripe carries no equivalent statement.
- The same paragraph asks for lifetime value to reach three times the original acquisition cost. That target is not the same number as a 3:1 ratio of the two.
Once one metric is an input to another, a change in the first one moves the second one without anything else happening. Churn is the clearest case, because it sits in the denominator of the published lifetime value formula.

A quarter like that produces a slide saying acquisition efficiency doubled. Acquisition did nothing. Retention did all of it, and the ratio reported the result under the other department's name.
Three chains worth naming
Churn feeds lifetime value, which feeds the LTV to CAC ratio. Cost per lead feeds acquisition cost, which feeds the same ratio from the other side. Win rate and deal size feed pipeline velocity, and the same compression happens there.
None of the three is exotic. All three are invisible in a list that prints the metrics as siblings.
Check the definition before comparing numbers
A metric name is not a metric. Before two numbers can be compared, both have to be computed the same way. The four numbers this page sends you to are each defined in one place with one arithmetic. Read the definition first and the benchmark second.
Here is what each name on the common lists answers, and where a full definition sits if this site has one.
The benchmarks you would compare against split on this. ChartMogul aggregated more than 2,100 SaaS businesses over the twelve months to March 2023 and publishes a methodology and glossary with the formulas beside the numbers.
SaaS Capital surveyed more than 1,000 private B2B SaaS companies for its fifteenth annual edition and reported a median growth rate of 22 percent. Its research brief does not say how growth was calculated.
Two benchmark reports, similar samples, and only one of them lets you check that your number and theirs are the same quantity. Read the methodology page before you read the percentile.
Every metric named on this page, one line each.
| Metric | What it answers | Full definition |
|---|---|---|
| Churn rate | What share of customers or revenue leaves in a period | SaaS churn rate |
| LTV to CAC ratio | Whether a customer returns more than it cost to win | LTV to CAC ratio |
| Cost per lead | What one lead costs before anything qualifies it | cost per lead |
| Pipeline velocity | How much revenue the pipeline produces per day | pipeline velocity |
| MRR | Recurring revenue booked every month | No full definition here |
| ARR | The same figure annualised over twelve months | No full definition here |
| ARPU | Average revenue per customer in a month or a year | No full definition here |
| Net revenue retention | Recurring revenue kept from existing customers over a period | No full definition here |
| Rule of 40 | Growth rate plus profit margin, read against a threshold | No full definition here |
The lookup takes a minute and it catches the expensive case. Two teams reporting lifetime value from two formulas will argue about the business when a divisor is what they disagree about.
Say you ask an agent to compare two decks. The ads-performance-analytics skill ships a glossary with the definitions side by side, and that is where we would send it for you.
Say you are handed a lifetime value of $13,333 and a benchmark of 3:1. Four checks decide whether those two numbers belong in the same sentence.
- Write down which formula produced your number, not just the number.
- Check whether acquisition cost is already inside it. That one line settles the section below.
- Check the window. Twelve times a monthly churn rate is not the annual rate, because churn compounds against a shrinking base.
- Only then compare against a benchmark, and only against one computed the same way.
Steps two and three are the ones that get skipped, and they are the two that change the answer.
Mismatched lifetime value: the effect on your ratio
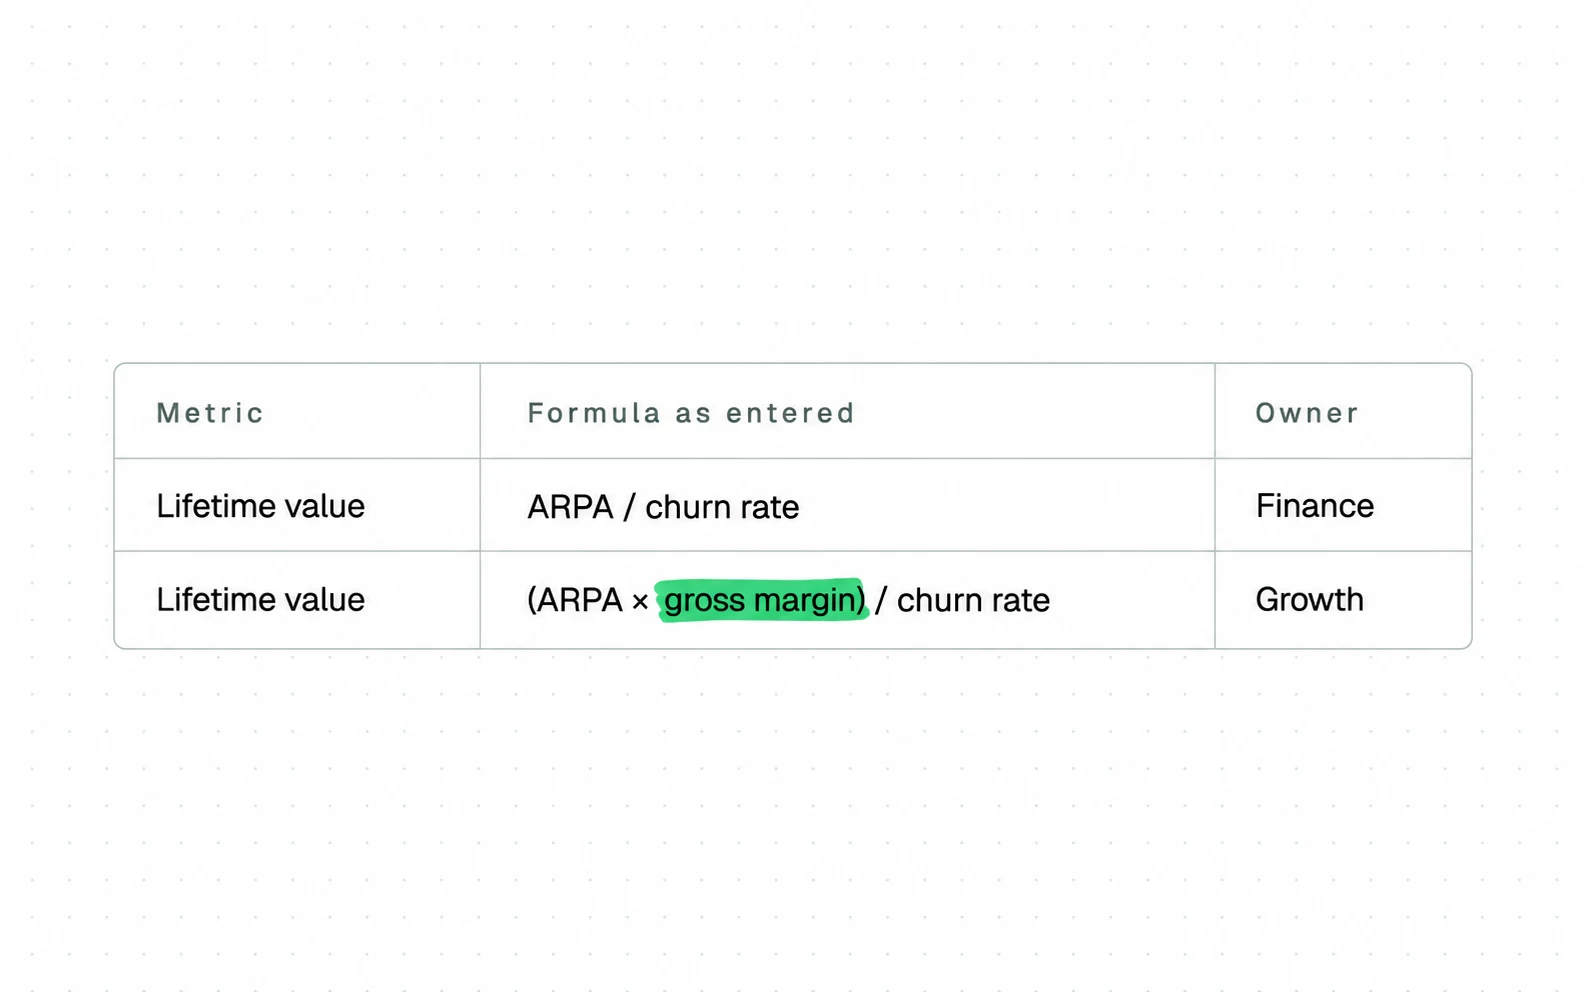
One name carries two quantities here, and the gap between them lands on either side of the 3:1 target. One definition takes lifetime value net of acquisition cost. The other takes it as revenue times gross margin divided by churn, with acquisition cost left in. Dividing the first by acquisition cost counts that cost twice.
A third definition is in circulation with a sample behind it. Benchmarkit, whose 2024 report draws on roughly 1,000 B2B SaaS companies reporting 2023 figures, publishes lifetime value as ARPA times subscription gross margin, divided by one minus gross revenue retention.
That version has no churn denominator and no acquisition cost in it at all. Three published formulas, one name, and your ratio moves depending on which one your board read last.
For instance, run both definitions on your own company, in one quarter, with one set of inputs.

A full point of ratio, from a definition mismatch. One reading clears the 3:1 line the overview calls healthy and the other does not, on the same company in the same quarter. Which of the two reaches your board depends on which formula produced it.
Google’s own AI answer inherits the same ambiguity. In the version recorded on 27 August 2026 it defines lifetime value as total gross profit or revenue from a customer.
That is two quantities in one sentence. The same overview carries the 3:1 target, and if you take it at face value the target holds for only one of them.
Getting this wrong is not a reporting embarrassment. Your budget moves, against a number computed for a different question.
Suppose the acquisition number is the one moving your budget: that is SaaS SEO agency work at Addition, a search marketing agency.
Common mistakes in SaaS metrics lists
The lifetime value mismatch is one instance of a wider habit, and four of them show up around these numbers. None is an arithmetic mistake. Each is a reporting reflex that survives because a metric name looks self-explanatory, and each costs a reader more than a wrong formula would.
Four habits and what each one hides.
| Habit | What it hides |
|---|---|
| Printing metrics as a flat list | That some of them are computed from the others, so two entries can never move independently |
| Naming a metric without its formula | That the same name is published in two arithmetics, and the reader cannot tell which one arrived |
| Quoting a benchmark without its window | That a monthly and an annual churn rate are not on the same scale |
| Reporting a composite alone | That two of its inputs may have moved in opposite directions and cancelled |
The second habit is the expensive one and also the easiest to fix. A formula beside a metric costs you one line and removes the entire class of error this page describes.
For example, a slide reading LTV $13,333 tells you nothing about whether acquisition cost is already out of it. The same slide reading LTV $13,333, revenue times margin divided by churn, settles that before anyone asks.
The third gets missed because churn compounds. Three percent a month is not thirty-six percent a year, and a page quoting one band against the other is comparing two different numbers under one name.

Nine counts above, and seven came from summaries. Where a summary is quoted the page says so and quotes it as far as it goes.
All four habits share one cause: a number reaches you without the arithmetic that made it. That is a travel problem, and it has a one line fix.
Report the definition beside each number
A SaaS metric travels badly. It leaves the spreadsheet where it was computed, lands on a slide, and arrives without the arithmetic that produced it. The fix costs one line per number, and it works whether or not anyone agrees on which metrics belong on the list.
Three things travel with a metric or you should not let it travel: the formula, the window, and the date your inputs were pulled.
The habit is not unreasonable to ask for, because published reports do it. Benchmarkit prints its CAC ratio as total sales and marketing expenses divided by new customer ARR, on the same page as the number.
Its 2025 page carries the formulas and does not state how many companies are behind them, so you get half the line. Half is still more than a bare percentile gives you.
That is the whole discipline. Unglamorous, and it settles every disagreement on this page. Both sides of an argument about lifetime value can see in one glance whether the company or the divisor is what they disagree about.
For the four metrics defined on this site the formula and the window sit in the entry. Send a colleague who disagrees with a number there. SaaS churn rate holds the retention arithmetic and its windows, and cost per lead holds the acquisition one.
For the five with no definition here, name them and say the definition sits elsewhere. A named gap costs you less than a definition recalled from memory, and the table above takes that advice.
Everything on this page is produced somewhere before it is reported, and the SaaS marketing funnel is where the acquisition side of it happens.
Sources
- David Sacks and Ethan Ruby, Craft Ventures The SaaS Metrics That Matter, first published 18 October 2021 and carried on Grid, the tool the essay announced: lifetime value defined net of acquisition cost, in six categories
- Stripe SaaS metrics: a complete guide to tracking business performance, 13 April 2026
- Wall Street Prep Customer lifetime value, defined as average revenue times gross margin divided by churn
- Maxio 15 SaaS metrics that matter most for SaaS companies, updated May 2026
- The SaaS CFO Scaling with confidence: the ultimate SaaS metrics playbook, 25 November 2024
- Paddle The ultimate SaaS metrics guide: what to track and why
- Growth Equity Interview Guide Top SaaS metrics: what investors and entrepreneurs need to know
- Breaking Into Wall Street SaaS metrics: definitions, Excel examples and real-world uses
- Equals The guide to SaaS metrics
- Andreessen Horowitz 16 startup metrics, by Jeff Jordan, Anu Hariharan, Frank Chen and Preethi Kasireddy, 21 August 2015
- ChartMogul SaaS Benchmarks Report: more than 2,100 SaaS businesses, aggregates over the twelve months ending March 2023, companies active for the full period only, and a published Methodology and Glossary section carrying the formulas
- SaaS Capital 2026 Private B2B SaaS Company Growth Rate Benchmarks, fifteenth annual survey, more than 1,000 private B2B SaaS companies, median growth 22 percent, 20 percent bootstrapped and 25 percent equity-backed
- Benchmarkit 2024 SaaS Performance Metrics: roughly 1,000 B2B SaaS companies reporting 2023 figures, with published formulas including customer lifetime value as ARPA times subscription gross margin divided by one minus gross revenue retention rate
- Benchmarkit 2025 SaaS Performance Metrics: CAC ratio published as total sales and marketing expenses divided by new customer ARR, with the participant count not stated on the page
- Google AI Overview Overview for the query saas metrics, as it stood on 27 August 2026; overviews are regenerated per search and the live one may differ
Questions people ask
What are the top 5 SaaS metrics?
No standard top five exists, and the published lists lead with fourteen, fifteen and twenty-two names instead.
One does name five. A search summary of it names churn, customer retention, customer acquisition cost, monthly recurring revenue and customer lifetime. The summary is cut off mid-phrase. That is one publisher's selection, quoted from a summary and not from the page.
What is the rule of 40 in SaaS?
The name carries the number: growth rate plus profit margin should add to forty. The overview Google returns opens on that definition and stops before the figure.
Both inputs are reported numbers, so it sits above this page. No full definition here.
What is the 3 3 2 2 2 rule of SaaS?
No published source defines a rule of 40 in these terms, so no definition follows.
Google suggests the question beside this term and the answers come back as metric lists. A definition repeated from memory would put an unsourced number in front of you, and naming the gap is the better trade.
What is KPI in SaaS?
A key performance indicator is any number a company decides to steer by, so the term describes a role and not a specific metric.
That is why the lists differ. Choosing which numbers deserve the role is the whole exercise, and this page is about what happens when those numbers turn out to contain each other.

