

What is SaaS churn rate?
Churn rate is the share of a subscription base lost in a period. The formula is not the hard part and never has been. The hard part is that the same word covers two different counts, and both of them are published as though there were only one.
Customer churn counts people. Divide the customers lost in a period by the customers you had at the start.
Both formulas are easy to find, the overview Google returns included, and neither answers the question underneath them. Which of the two you are looking at is the question it leaves out.
Revenue churn counts money. Divide the recurring revenue lost by the recurring revenue you started with, so a downgrade registers and a cheap cancellation registers less.
A company with heavy small-account turnover and a stable enterprise base can report a frightening customer churn and a comfortable revenue churn in the same quarter. Neither number is wrong.
Every benchmark on this page counts departures and not money, and even inside that the unit shifts.
Recurly counts subscribers, and one account can hold several subscriptions. Check what a source counted before you hold your own number against it.
Why published averages disagree
The published averages for SaaS churn run from 3.22 percent to 14 percent. That spread is among figures using the same annual window, counting departures and not revenue. That looks like a window problem and it is not one.
Four published averages for the same category, and what each one comes with.
| Source | Annual figure | Population named | Source attached |
|---|---|---|---|
| Recurly, July 2026 network data | 3.22 percent of subscribers | Its own subscription network | Its own data |
| Vena Solutions, September 2025 | 3.8 percent, or 4.9 for B2B | In its table, not its headline | Recurly and Paddle |
| Mercury, January 2026 | 2 to 8 percent, healthy | No | HubSpot and Stripe, second hand |
| Revenera, February 2025 | 10 to 14 percent | No | None |
The range is credited to HubSpot and Stripe, and neither attribution comes with a sample size. Recurly, the one row running on its own data, does not publish a sample either.
Split it by who is buying
Vena publishes the answer in a table that its own headline does not use. Once the customers are separated, the disagreement stops being a disagreement.
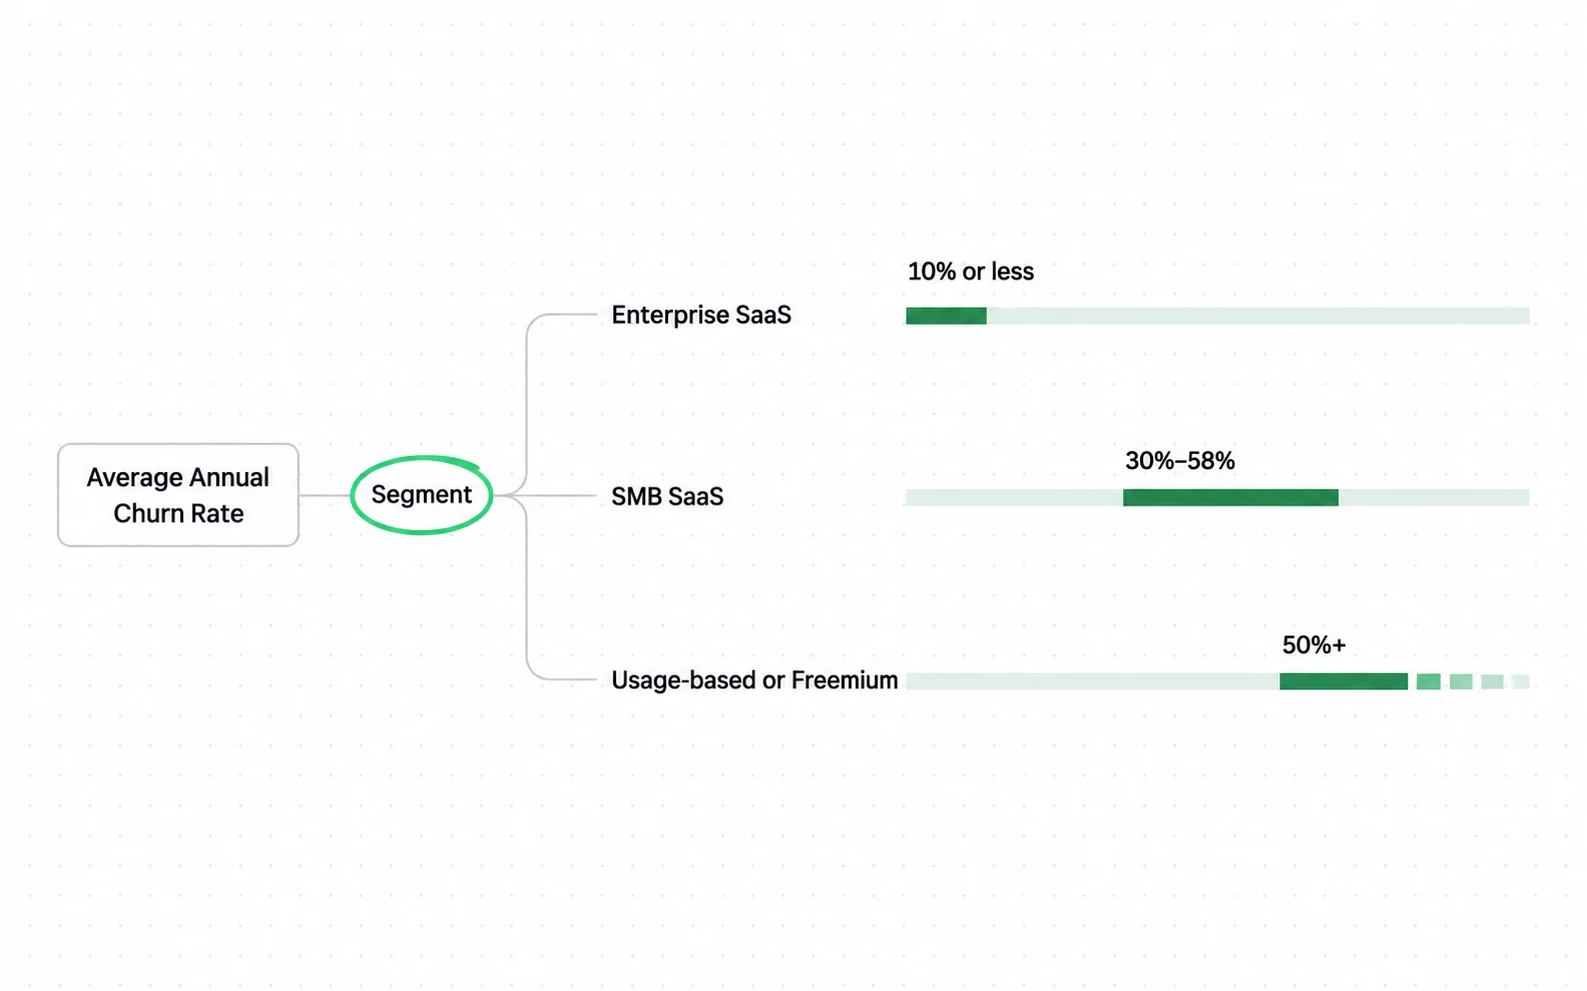
- Enterprise SaaS loses 10 percent of customers a year or less. Usage-based and freemium products lose 50 percent or more.
- That is a factor of five inside one category, which is wider than the gap between any two publishers quoting an average for it.
- The last two rows are monthly and the ones above them are monthly too, and the voluntary figure is larger than the overall B2B figure it should sit inside. Something in that table is inconsistent, so those rows are not used together here.
So a store of averages is not much use. Say your rate is 20 percent a year. That is twice the enterprise ceiling and below the small-business floor of 30 percent, so your number falls between two published bands and belongs to neither.
Cancellations vs payment declines
The total splits two ways, and almost nobody splits it: customers who decided to leave, and customers whose payment simply failed. and the second group is larger than most teams assume.

On those figures roughly a third of the loss is a billing event. An expired card, a declined transaction, a bank that blocked a recurring charge.
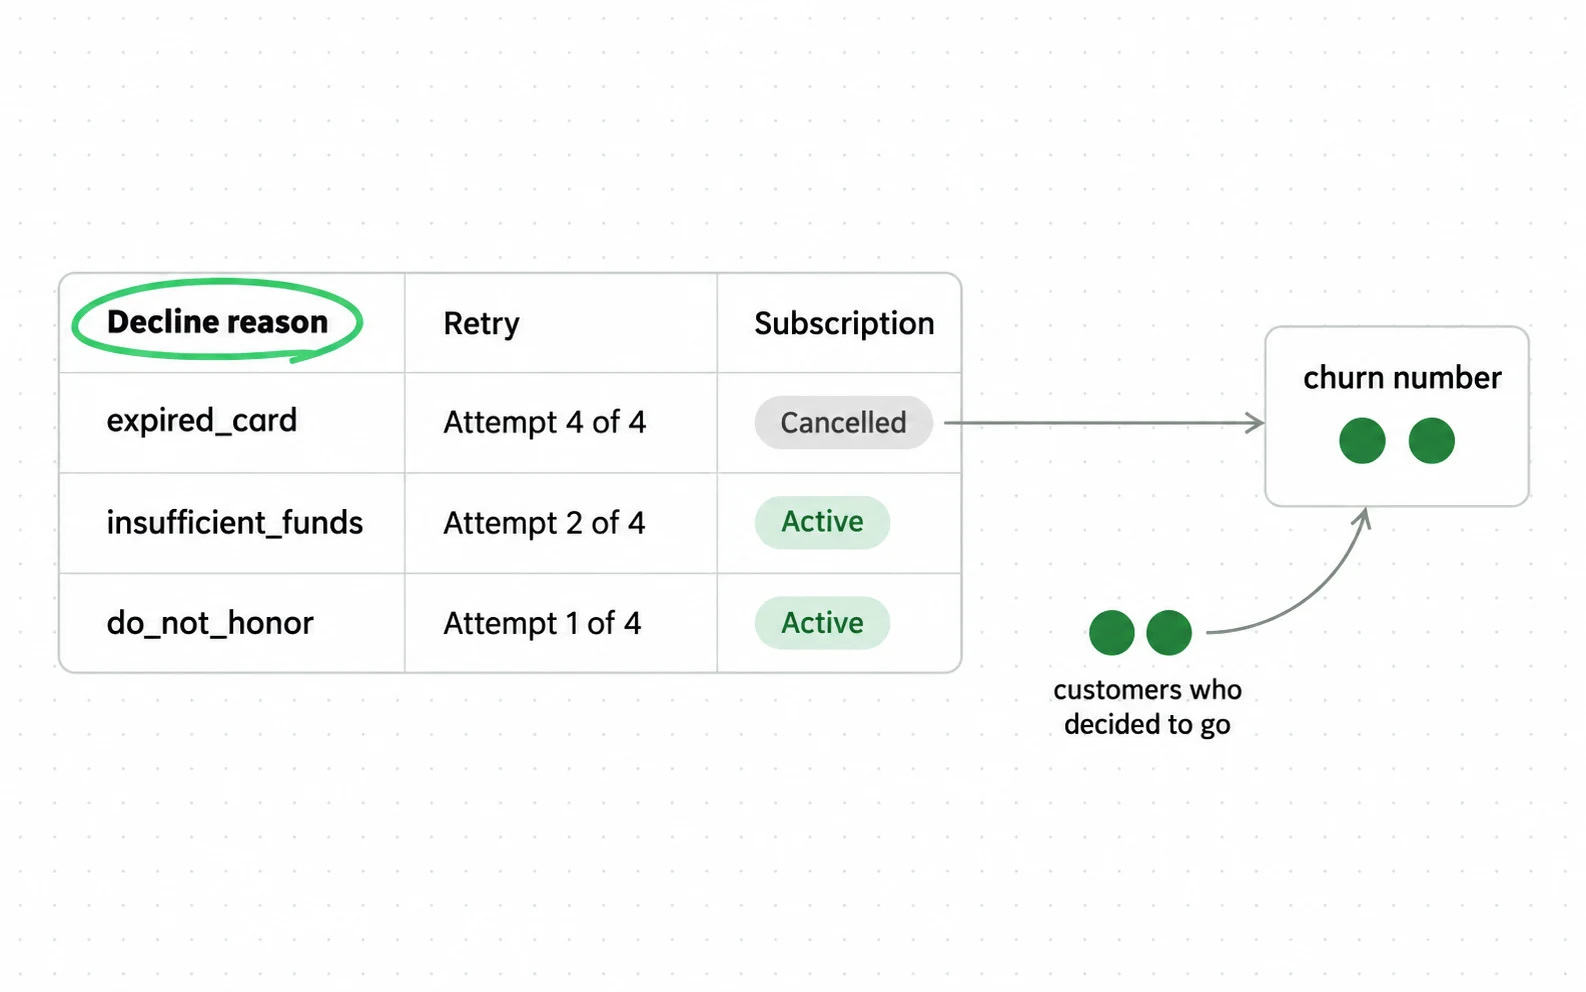
That third has nothing to do with your product and it does not respond to anything you would do about a product. It responds to card updater services, retry schedules and dunning emails.
A forum thread carries the same observation in its title, from an operator: most of their churn was failed payments. That is one person and not evidence, and it points at the same place the network data does.
Metrics commonly confused with churn
Three neighbouring numbers get used as though they were this one. Each answers a question churn cannot answer, and mixing them is how a healthy business reads as a failing one or the reverse.
Four numbers, four questions.
| Number | What it answers |
|---|---|
| Churn rate | What share of the base left |
| Retention rate | What share stayed, which is the same fact stated from the other side |
| Net revenue retention | What the surviving base is worth now, so expansion can push it over 100 percent |
| Lifetime value | What one customer is worth before they go, which needs churn as an input |
Monthly and annual rates are the fourth confusion. A 1 percent monthly rate is not 12 percent a year, because each month is measured against a base the previous month already reduced.
State the window beside the number. Two figures with no window attached cannot be compared at all, and the ranges above show how far apart they can sit.
Decisions that depend on the rate
Churn is an input, not a conclusion. Two decisions sit downstream of it, and both change when the rate moves, which is why the number is worth measuring properly instead of benchmarking loosely.
The first is what a customer is worth. Lifetime value takes your churn rate as its denominator, so an error here scales into every acquisition decision you make from it, and the LTV to CAC ratio inherits it whole.
The second is where the money goes. A business losing half its customers a year is buying the same customers repeatedly, and no acquisition channel outruns that. Products in the freemium band above face this arithmetic first, which is one of the things whether product-led growth fits your price has to answer for.
Measure it monthly, split it into voluntary and involuntary, and record which of the two counts you used. Then compare yourself against your own segment row and not against a category average.
Suppose you want acquisition moved: that is SaaS SEO agency work at Addition, a search marketing agency.
Sources
- Recurly Churn rate benchmarks, July 2026 network data, with the voluntary and involuntary split
- Vena Solutions 2025 SaaS churn rate benchmarks, formulas and segment table, 19 September 2025
- Revenera SaaS churn rate: your ultimate survival guide, 28 February 2025
- Recurly Churn rate benchmarks: SaaS, media, retail and more industries, July 2026 data
- Mercury Understanding the different types of SaaS churn, 19 March 2024, updated 2 January 2026
- Google The AI Overview for this term, giving the customer and revenue formulas
Questions people ask
What is a good churn rate for SaaS?
The published answers range from under 5 percent a year to 14 percent, and they are answering for different customers. Enterprise software sits at 10 percent a year or less. Businesses selling to small companies sit between 30 and 58 percent, and freemium products above 50.
Find your row before you judge your number. If your rate is 20 percent a year, that is twice the published enterprise ceiling and below the small-business floor of 30 percent, so your number lands between two bands.
How do you calculate SaaS churn rate?
Customer churn is the number of customers lost in a period divided by the number you had at the start, expressed as a percentage. Revenue churn replaces both counts with recurring revenue, so a downgrade counts and a cheap cancellation counts for less.
The two answer different questions and neither is the correct one. Pick the one that matches the decision, and print which you used.
What is the difference between voluntary and involuntary churn?
Voluntary churn is a customer choosing to leave. Involuntary churn is a payment failing, usually an expired or declined card, with no decision behind it.
Recurly puts the SaaS split at 2.16 percent voluntary and 1.06 percent involuntary a year. On those figures about a third of the total is a billing problem, not a product one, and the two have completely different fixes.
Is monthly or annual churn the right measure?
Both, and they are not interchangeable. A 1 percent monthly rate is not a 12 percent annual one, because each month compounds on a smaller base.
The practical rule is to state the window every time. A figure quoted without one cannot be compared against anything.

