

What does conversion rate optimization mean?
Conversion rate optimization is the practice of raising the share of visitors who complete the action a site exists to produce, using controlled tests, not opinion. For a store, that action is an order.
Untested is not optimised.
The word optimization implies a comparison. A change never measured against the version it replaced has not been optimised, it has just been made. The comparison matters because most changes lose: published success rates put even the strongest programs between 8 and 33 percent.
Calculating conversion rate: the formula and two denominators
Divide conversions by visits in the same period, then multiply by one hundred. A store with 50 orders from 1,000 sessions converts at 5 percent. The formula is the easy part. The word visits is where the trouble starts, because there are two published answers to it.
| Term | What it counts | Common trap |
|---|---|---|
| Conversion rate | Orders divided by sessions | Says nothing about what an order was worth |
| Average order value | Revenue divided by orders | Rises when you lose small buyers, which looks like a win |
| Revenue per visitor | Revenue divided by sessions | Harder to move, which is why it is the one to steer by |
Two metrics, one name.
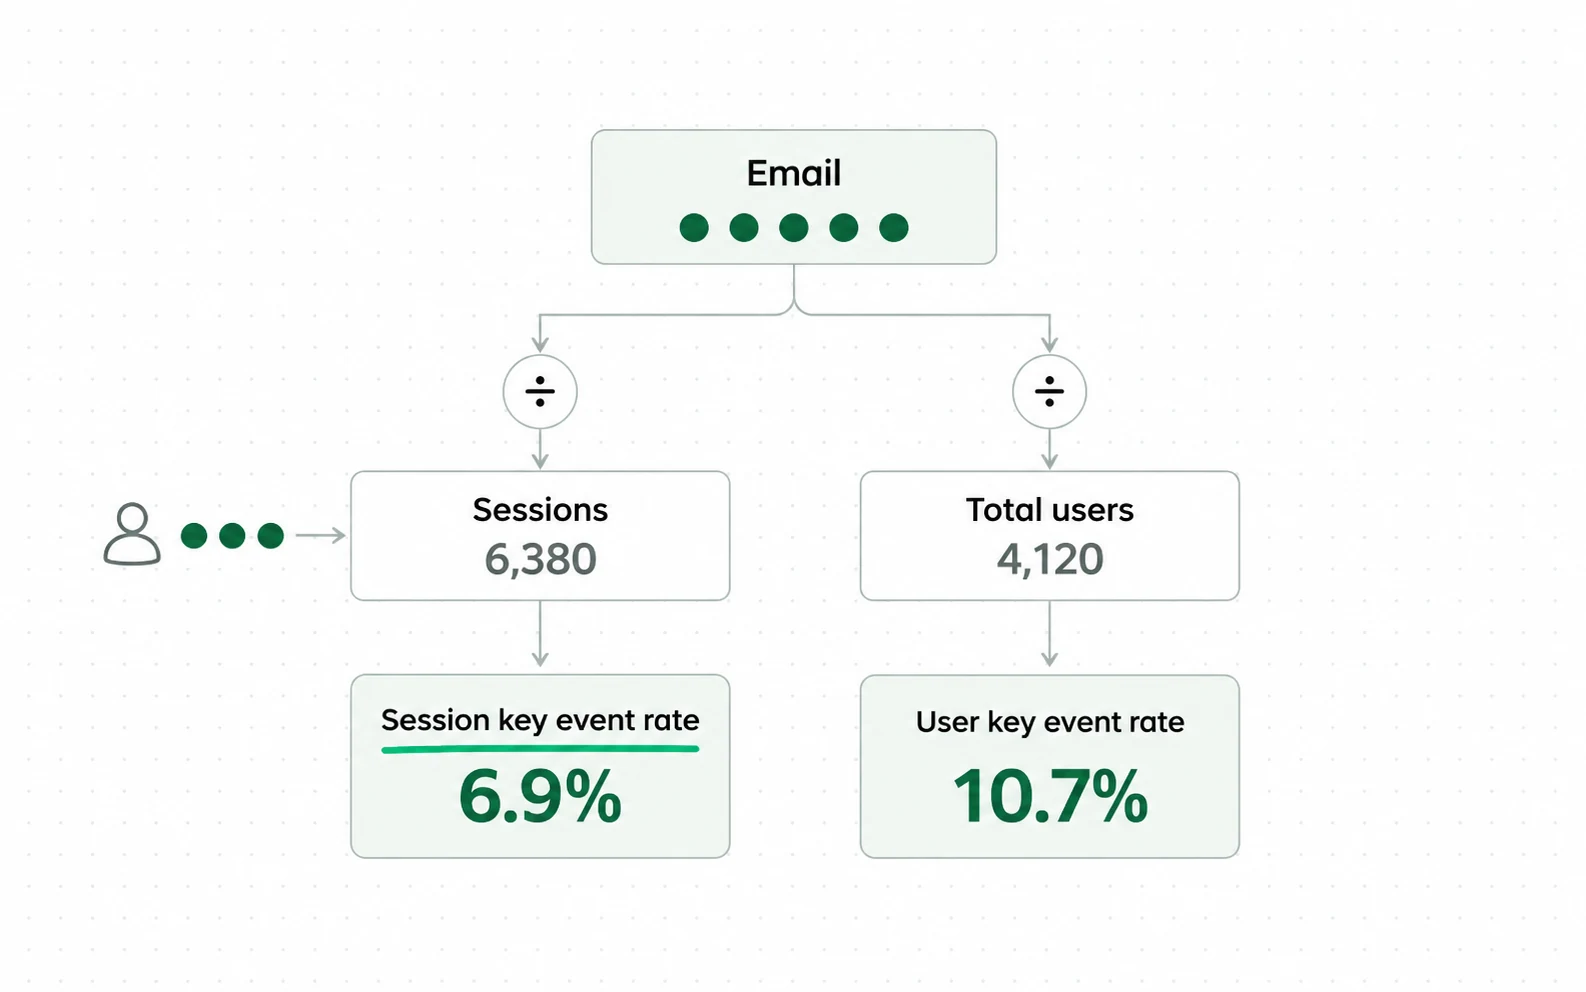
Google Analytics defines two separate metrics in its Data API schema, and both are called a rate of conversion. sessionKeyEventRate is the percentage of sessions in which any key event was triggered. userKeyEventRate is the percentage of users who triggered any key event.
| Metric | Divides by | What moves the denominator |
|---|---|---|
| sessionKeyEventRate | Sessions | Every return visit adds one, whether or not the person buys |
| userKeyEventRate | Users | A person counts once however many times they come back |
The same denominator question follows a paid click. What you pay in a Google Ads auction is set per click, so whether that click paid for itself depends on what the order was worth, not on the rate alone.
Say you have settled the basis and want your page reviewed in seven dimensions. The cro skill returns that review from a URL and a stated goal.
This is why two dashboards disagree about the same week, and why a benchmark can flatter you without anyone lying. IRP Commerce states its own basis explicitly: transactions divided by sessions.
The two rates count different things on both sides of the line, so yours are not interchangeable. Work out both on your own data before you hold either against a benchmark, and check which basis that benchmark used.
Conversion rate limits as a single number
A comparable denominator tells you whether the rate moved. It does not tell you what the movement cost, and the cheapest way to move it is also the most expensive. A discount lowers what each order is worth, and it is usually run in the expectation that more people will buy. Judged on the rate it reads as a win. Judged on revenue it can be a loss.
Sector averages are not targets.
The discount case is arithmetic, not bad luck. A lower price raises the rate and lowers average order value at the same time, and revenue per visitor is the product of the two.
A benchmark can state its scale and still leave the question open. Littledata's ecommerce benchmark page puts the Shopify median at 1.4 percent across 2,800 sites, and gives the year. That page does not say whether the rate is per session or per user. Read any benchmark for that line before you compare yourself to it, because two people quoting the same number can mean different things.
The second way it misleads is comparison. In IRP Commerce's July 2026 data the highest sector converted at 5.23 percent and the lowest at 0.55 percent, a spread of 9.5 times inside one dataset in one month. An all-markets average of 2.26 percent sits between them and describes neither. Unbounce's landing-page benchmark shows the same shape with different numbers: a 7.1 percent median for food and beverage against 1.3 for fashion. Traffic source, business model and calculation method all differ between you and the average, so the comparison is structurally broken whatever the numbers. A benchmark describes the arithmetic in its own dataset, not a store.
Speed is the exception with a published number: the Core Web Vitals thresholds are written down, which is more than can be said for the rate itself.
What people say stops them is not subtle. It is also not a measurement of what happened. Read the next two figures as a shortlist to test, not a finding. In Bizrate Insights' 2026 survey of 1,010 US shoppers, 42 percent said unexpected fees make them abandon a cart often or very often. A 10 percent return fee put 72 percent of them off ordering from you at all.
CRO vs SEO: what is the difference?
Those are all things you can do to the store. The most common confusion is about which discipline owns them. SEO mostly changes how many people arrive and CRO mostly changes what happens once they do, and the two overlap wherever the landing page is the thing being ranked. They fail differently, so a single combined number hides which half is broken.
They fail in different places.
The other frequent mix up is conversion rate with click through rate, which Google Ads defines as clicks divided by impressions: it counts people who clicked an ad. High clicks with low conversions tells you the ad worked and something after it did not; which thing is what the next step has to find.

Full guide to running tests and trusting results
How the work is run, from sizing a test to knowing when a result can be trusted, is covered in our full guide to conversion rate optimization for ecommerce. The mechanics of a single experiment are in how an A/B test is run.
One rule from it belongs here: a test recorded only when it wins teaches nothing.
Before you compare your rate to anyone else’s, find out which of the two your dashboard is showing you. Most reports do not say, and the two answer different questions.
Once you know which of the two you are reading, the page changes that move it are landing page optimization.
Whenever someone performs an action that's meaningful to your business, you can measure the action as a key event.
Google Analytics Help, How to measure key events read 7 October 2026
- Google puts the choice on you. Anything meaningful to the business can be a key event, and nothing on the list is a conversion by nature.
- So an identical rate at two stores can describe completely different behaviour.
Sources
- Littledata Average ecommerce conversion rate, Shopify median 1.4 percent across 2,800 sites; denominator not stated Dated 2023 with no month given, so its exact age is not knowable from the source.
- Bizrate Insights Ecommerce conversion optimization drivers, survey of 1,010 US adults, 3.1 point margin
- The Good Why industry benchmarks are misleading: traffic source, model and method differ Measured 21 months ago, on a surface that has moved since.
- Google Analytics Help How to measure key events: session-based and user-based rates
- Kohavi, Deng and Vermeer A/B Testing Intuition Busters, KDD 2022, published program success rates
- Unbounce Conversion Benchmark Report, median landing-page conversion rates by industry Measured 2 years ago, on a surface that has moved since.
- Google Ads Clickthrough rate (CTR): Definition
- Google Analytics Data API schema, sessionKeyEventRate and userKeyEventRate
- IRP Commerce Ecommerce Market Data, July 2026, session conversion rate
Questions people ask
What is a good CVR?
There is no useful answer without the average order value next to it. Two percent on a 400 dollar basket and two percent on a 40 dollar basket describe different businesses.
Is a 2% conversion rate good?
It cannot be answered without two more facts: which denominator, and which sector. Google Analytics defines a session-based rate and a user-based rate, and the same store scores differently under each.
In IRP Commerce's July 2026 data the top sector converted at 5.23 percent and the bottom at 0.55 percent. Two percent is unremarkable in one of those worlds and excellent in the other.
What is CRO and SEO?
CRO is conversion rate optimization, turning visitors into buyers. SEO is search engine optimization, getting them there. They only pay off together.
How do you optimize conversion rate?
By comparing versions at random against a written hypothesis, with the sample size planned before launch. One change at a time is not a requirement; it is what makes a winner easy to explain, and a multi-element test is still valid if you accept not knowing which element did the work. The conversion rate optimization guide covers each step.

