

What is average order value?
Average order value is total revenue divided by the number of orders over the same period, and the arithmetic is not in dispute anywhere. What the number is for, and what it hides when it moves, is where the disagreement starts.
Revenue divided by orders. That is all.
The part worth pausing on is what the word average is doing. AOV is an arithmetic mean, and a mean answers what one order is worth on average. That is not the same question as what a typical order is worth, and the two answers separate whenever the values are lopsided. Whether yours are is a question about your own orders, and AOV cannot answer it. One order ten times the size of the rest moves the mean and leaves the median where it was, and the mean carries no mark of having been moved.
| Statistic | What it answers | What a store usually finds |
|---|---|---|
| Mean, which is AOV | Total revenue divided by total orders | Moves when any single order value moves |
| Median | The value at the middle of the sorted list | Unmoved by how large the largest order is |
| Mode | The order value that occurs most often | In Shopify’s worked example, $15 against a $24 mean |
Published averages next to a real range
IRP Commerce publishes an all-markets figure alongside the sectors it covers. Reading the three numbers together shows what an average across many businesses can and cannot tell you.
The average sits near the bottom of the range.
Traffic source, business model and calculation method all differ between stores, so a sector average has nothing to hold your own figure against.
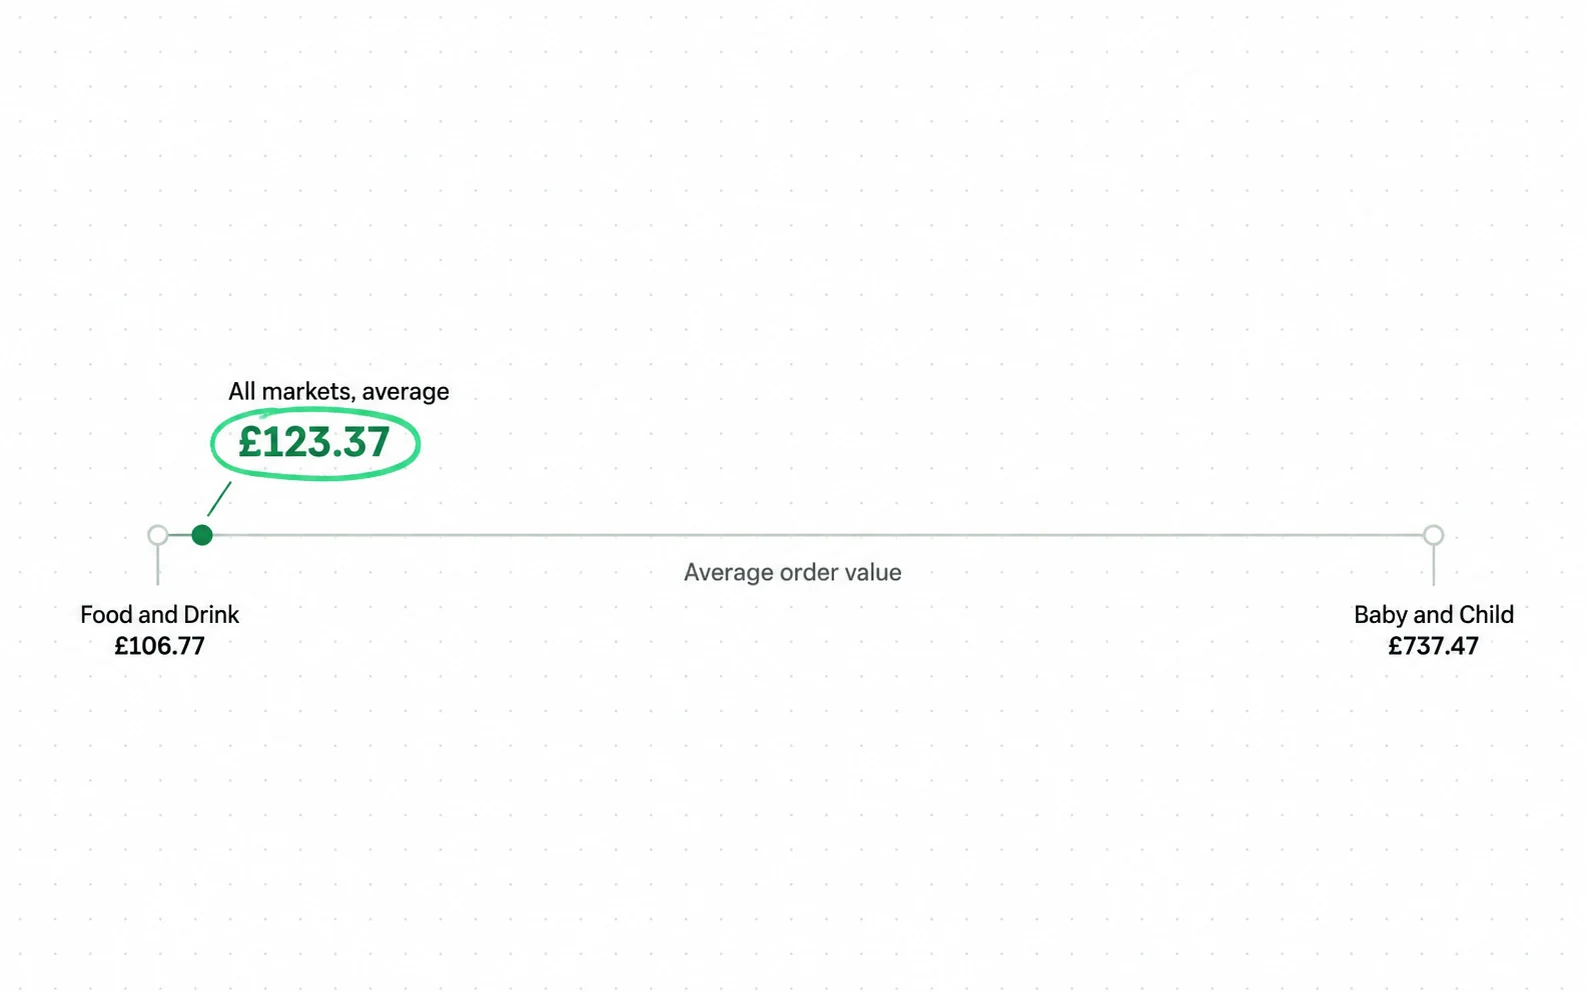
Dynamic Yield’s benchmark is quoted at about $145 across industries, with luxury and jewellery often above $300 and beauty closer to $15 to $90. Those ranges are wide for the same reason. They describe different businesses, and a single figure spanning all of them tells one store nothing about where in the range it should sit.

That is the practical reason not to chain published metrics together. Each figure may be right on its own terms, and nothing on the page tells you they were computed on a shared basis.
So a benchmark is useful for one purpose, which is noticing how far apart sector levels are. A benchmark is not useful as a target, and the two get confused every time somebody quotes a single figure without a sector beside it.
Why can average order value rise while the business gets worse?
A number that cannot be compared outward can still mislead you inward, and here is how. This failure mode is arithmetic, not bad luck. AOV has orders in the denominator, so anything that removes small orders raises it.
Losing small buyers looks identical to selling more.
Bizrate Insights surveyed 1,010 US adults and found 42 percent abandon over unexpected fees, so a threshold that pushes shipping cost into view does turn buyers away. What it does not measure is where to set the threshold.
The one line on a bag screen that moves your average
Your bag
- Subtotal
- $38.00
- Add $12.00 for free shipping
- Threshold $50.00
- Shipping
- $6.95
- Order total
- $44.95
- The marked line is the lever. It asks this buyer to add twelve dollars, and every bag that grows raises the average.
- It is also where a fee stops being unexpected, which is the moment the survey above is about.
- The screen records the bag that grew. It records nothing about the bag that closed, and the average rises either way.
Suppose a shipping threshold turns away the customers whose baskets fall below it. The orders that remain are larger, the average rises, and total revenue falls. That is arithmetic, not a measured outcome, and it is enough to make the point: read on its own, AOV reports a win in that case. Read next to order count and revenue, it reports what happened.
| What changed | AOV | Orders | Revenue |
|---|---|---|---|
| You sold more per order | Up | Flat | Up |
| You lost the smallest buyers | Up | Down | Down |
| You discounted successfully | Down | Up | Up |
| You discounted unsuccessfully | Down | Flat | Down |
Read AOV alongside conversion rate and revenue per visitor, never on its own. So report revenue per visitor beside them, the headline number in conversion rate optimization. It carries both inputs, so a change in either one shows up in it.
Average order value vs average spend per customer
That is the arithmetic. The other common error is a naming one: two metrics get used interchangeably and they answer different questions. AOV divides by orders. Spend per customer divides by people, and a customer who buys three times counts once in one and three times in the other.
AOV also travels into ad maths without anyone changing an ad: return on ad spend divides revenue by spend, so a basket that grows moves ROAS on its own. Know that before a ROAS change gets credited to the campaign.
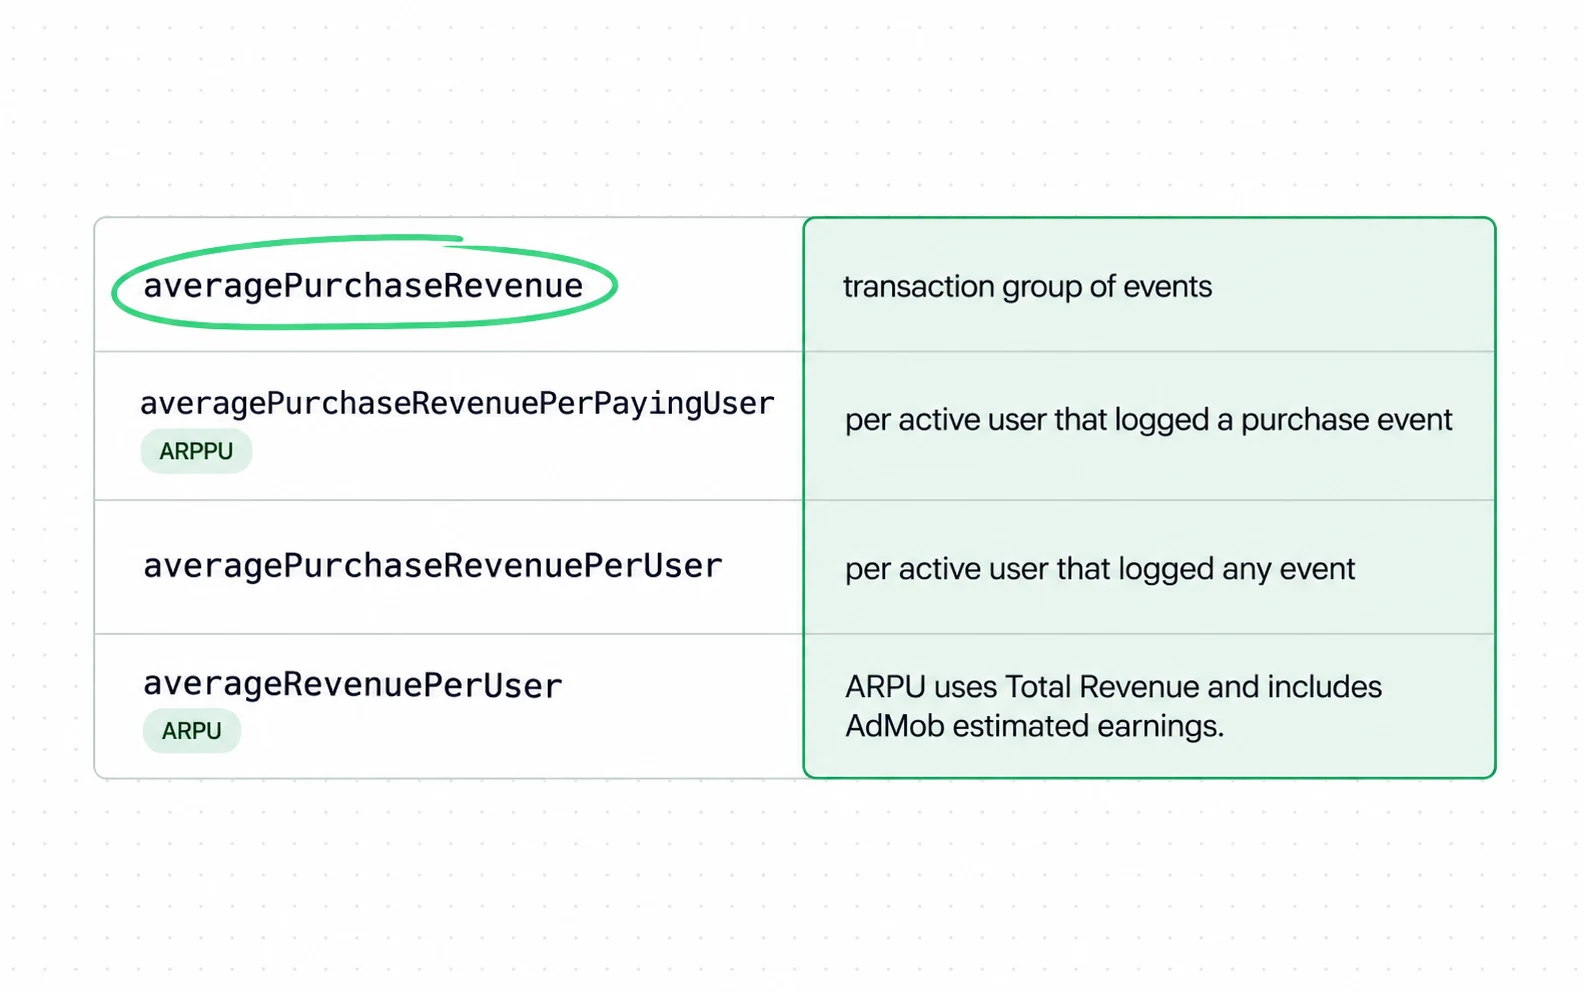
- The first row is the one this page is about. The three under it divide by people, and two of those three do not even use the same set of people.
- ARPPU counts users who bought. The one below it counts users who did anything at all. A store with a lot of browsers gets very different numbers from the two.
- ARPU is a fourth thing again: total revenue, AdMob earnings included. Nothing in a dashboard label tells you which of the four is behind the figure you are reading.
One counts baskets, the other counts people. That difference matters most for a store with repeat purchase. One 90 dollar order and three 30 dollar orders bring the same revenue and produce different AOVs, because the second case is counted three times in the denominator. Which of the two is worth more to the business is a separate question, and AOV is not asking it. Which denominator you are looking at is the same question what a conversion rate is settles for the rate. Neither figure announces its answer on the face of a report.
Related reading on average order value
How to move it, and how to tell whether a change to it was worth making, is the subject of our guide to conversion rate optimization.
One habit from it belongs here: when AOV moves, look at order count and revenue in the same window before deciding what moved it.
Pull your last 200 orders and sort them by value. Average the hundredth and the hundred and first, which is your median order. Now subtract the median from your AOV and keep the sign. Near zero and your average sits close to the middle of your orders. Clearly positive and a handful of large orders are pulling it up, which is the case that makes an average misleading. Negative is rarer and means the opposite. Wherever your reporting shows an average with no median beside it, the sign is the part you have to work out yourself.
Suppose the gap is wide: moving it on your own pages is landing page optimization at Addition, a search marketing agency.
Sources
- IRP Commerce Ecommerce Market Data, July 2026: sector average order value from £106.77 to £737.47, all markets £123.37
- Shopify Average order value: the formula, the mean against median and mode, and a global figure around $145 This page carries no publication date of its own.
- Optimizely Average order value: divide total revenue by number of orders, and read it alongside conversion rate and revenue per visitor
- Bizrate Insights Ecommerce optimization drivers, survey of 1,010 US adults: 42 percent abandon over unexpected fees
- Google Analytics Data API schema: sessionKeyEventRate and userKeyEventRate, two metrics with different denominators
- The Good Why industry benchmarks are misleading: traffic source, model and method differ between stores
Questions people ask
How to calculate average order value?
Divide total revenue by the number of orders in the same period. A store with $6,000 of revenue from 200 orders has an AOV of $30. Use the same date range for both numbers, and decide once whether revenue includes shipping and tax, because the answer changes the figure.
What is the average order value?
There is no single figure. In IRP Commerce’s July 2026 data one sector averaged £737.47 and another £106.77, with an all-markets figure of £123.37 that sits nearer the floor of that range than the middle. A platform guide cites a global figure around $145. Both are facts about a mix of businesses, not a target.
What is ASP and AOV?
Both are averages, over different things. IRP Commerce publishes them side by side for July 2026: average order value £123.37 and average sale price of item £63.71. A basket of three items is one order and three units, so AOV rises when people buy more items as well as when they buy dearer ones. Divide one by the other and you get items per order, and it is that third number, not the pair, that tells you which of the two moved.
How to count average order value?
Count orders, not customers and not sessions, and count revenue on the same basis for the same dates. Decide once whether shipping, tax and refunds are inside the revenue figure, because two people counting the same month can get two different answers and neither report will say so on its face.

