

What do the three Core Web Vitals metrics measure?
Core Web Vitals are three measurements of what a page feels like to use. How quickly the main content arrives. How fast the page answers a tap. And how much the layout moves while it loads. Google publishes a good threshold for each of the three, and publishes the rule for how each one is counted.
web.dev, Web VitalsThe three thresholds, and the sentence that qualifies all three
Addition’s own panel. The three thresholds are Google’s, from its Web Vitals page, last updated 31 October 2024. The 75 percent sentence is condensed from Google’s page on how the thresholds were defined, last updated 7 May 2025. Both read 7 October 2026.

Three metrics, and one of them changed its name recently. A lot of published advice has not caught up. web.dev announced that Interaction to Next Paint would replace First Input Delay on 12 March 2024, and FID was dropped from Search Console the same day. The difference is not cosmetic. FID measured only the delay before the page began responding to the first tap. INP measures how long the page takes to show the result, and it looks at every interaction, not the first one. A page could pass FID comfortably and still feel unresponsive on the fifth tap.
The threshold everyone quotes is the top of a three-band scale. The middle band is the one that tells a failing store how far it has to go, and it is the one that gets left out.
| Metric | Good | Needs improvement | Poor |
|---|---|---|---|
| Largest Contentful Paint | 2.5s or less | Over 2.5s to 4s | Over 4s |
| Interaction to Next Paint | 200ms or less | Over 200ms to 500ms | Over 500ms |
| Cumulative Layout Shift | 0.1 or less | Over 0.1 to 0.25 | Over 0.25 |
Counting rules behind the published thresholds
The thresholds are published and easy to quote. Three separate counting rules decide whether you meet them, and no single Google document states all three together.
The counting rules do the deciding.
| The rule | What it does to your grade | Where Google states it |
|---|---|---|
| Assessed at the 75th percentile | The slowest quarter of your visits decides it | web.dev, Web Vitals |
| A 28-day rolling average | Today’s number is a month of visits, not today’s | Chrome UX Report API |
| Scored as a URL group | The group takes the status of its worst metric | Search Console Help |
Why the 75th percentile is not an average
The percentile is the first one and the one that surprises people. Your ranking is determined by the slowest 25 percent of visitors. The two measures answer different questions. An average adds every visit up and divides, so one very slow visit and one very fast one can cancel out. The 75th percentile does not average anything. The line sits at exactly one quarter. A store fails when more than a quarter of its visits are slow, and passes when fewer are, however slow those few were. Thirty percent of visits over 2.5 seconds fails LCP. Twenty percent passes. Whether the average moved between those two stores depends on the rest of the distribution, which is the point: the grade does not consult it.
Suppose you run the seo-technical skill on your store without credentials. You get a lab reading of the three metrics and a note that it is lab. The field numbers this page describes appear only once you configure a Google API key.
The second rule sets how fast you can learn. Chrome UX Report data is, in Google’s own wording, a 28-day rolling average of aggregated metrics. People repeat that as a 28-day wait, and the wait is the part that is wrong. The window rolls, so improved visits start entering it within a couple of days and the old ones fall out one day at a time.

The third rule is the one written for catalogues and almost never quoted. Search Console does not grade your pages one at a time. It groups URLs that have a similar user experience, and once a group has enough data its status is its most poorly performing metric. For a catalogue that usually means a few verdicts covering thousands of addresses, and a single fast page cannot rescue the group it sits in. Google groups by experience, not by template, so the two often line up and are not the same thing.
Why do speed tests and Search Console disagree?
A page can score 95 in a speed test and sit in a failing group in Search Console at the same time. Neither tool is broken. They answer different questions and only one of them is the grade.
A speed test runs the page once, on a machine you do not own, over a connection you do not have. That is lab data, and it is the right tool for finding what to fix. The grade comes from field data, the Chrome UX Report. Real visits, real Chrome users, real devices. It collects only from users who opted into reporting, and never from iOS. Optimising the lab score and watching the field number stay flat is how a month of speed work goes unnoticed.
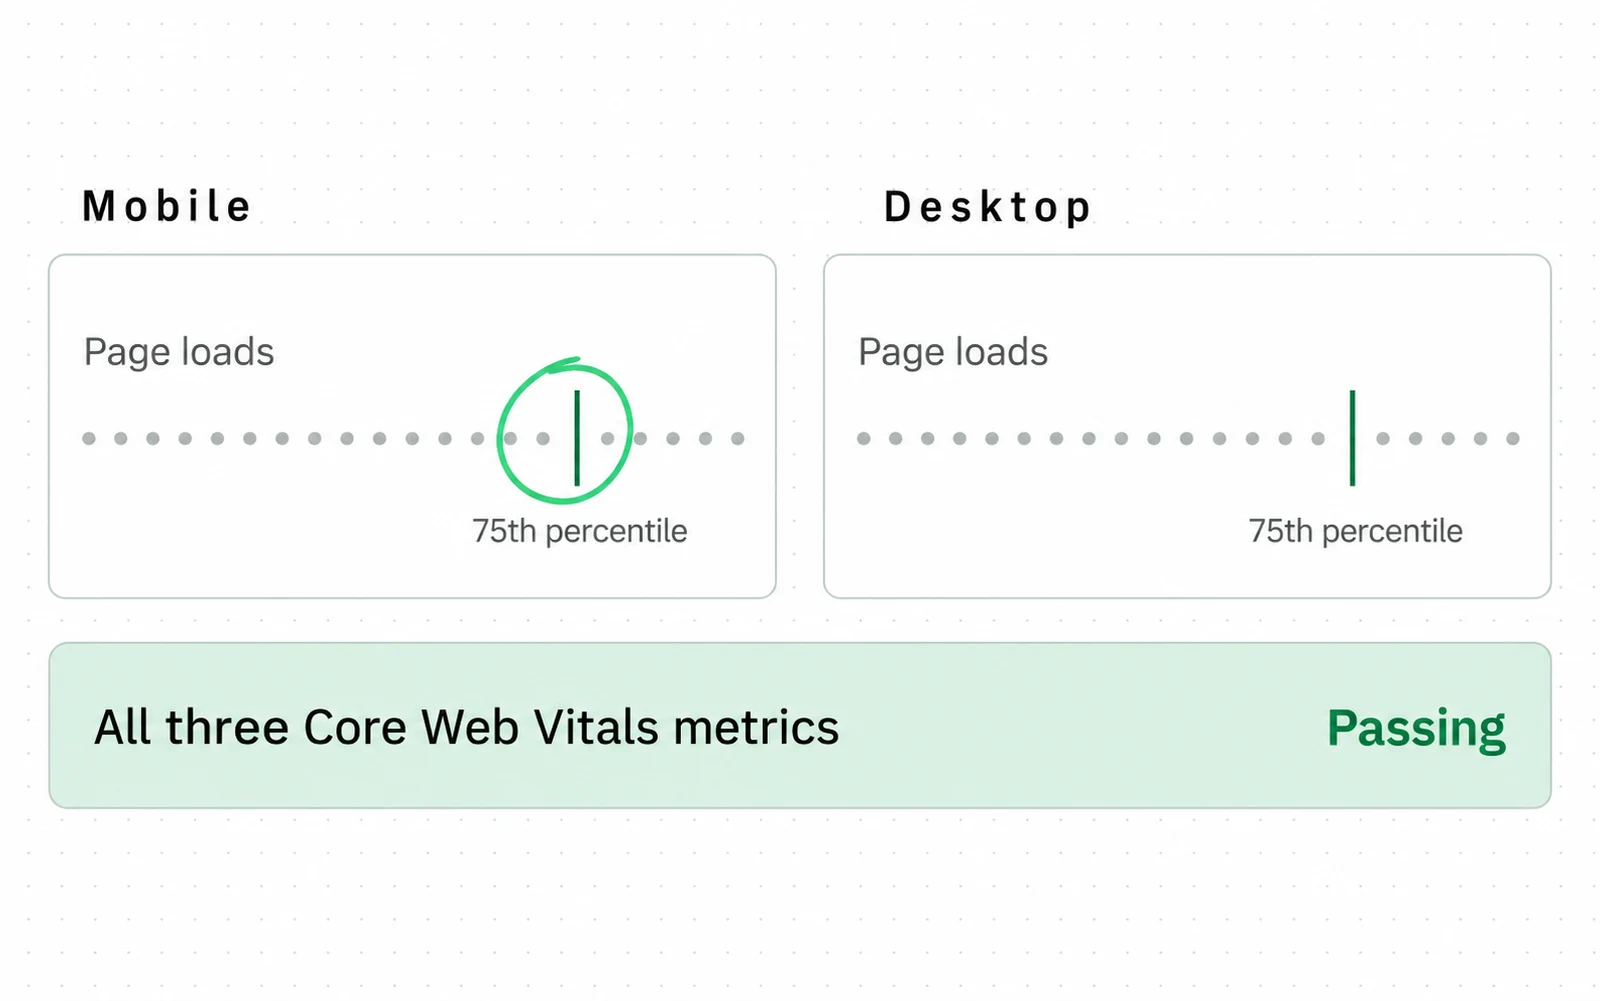
- The 75th percentile is the whole of the disagreement above. A speed test reports one load. The grade is set by the slowest quarter of your real visitors.
- All three, at that percentile. Two good metrics and one bad one is not two thirds of a pass.
- Segmented across mobile and desktop, so your phone visitors are graded on their own and a fast desktop cannot carry them.
The reason to care is that the field number moves money, and there is at least one controlled measurement of it. Vodafone ran a proper split test on a landing page, half the traffic to an optimised version and half to the baseline, roughly 34,000 visits a day on each side. A 31 percent improvement in Largest Contentful Paint came with an 8 percent increase in sales. One site and one page, so it is a demonstration, not a rate to plan with, and it is still more evidence than most speed claims carry. Faster pages give a store a chance at the sale. Turning that chance into revenue is where speed stops being the question and conversion rate optimization starts.
Pass rates by ecommerce platform
Speed buys a chance at the visit and nothing after it. The thresholds themselves are the same for everyone. The share of stores meeting them is not, and the spread between platforms is wide enough to matter before you plan any work.
Same test, very different pass rates.

Which of the three metrics the gap sits in
The gap is concentrated in one metric. In the same chapter, good LCP on mobile runs at 86 percent for Shopify and 39 percent for WooCommerce. The other two metrics sit far higher on both. INP at 90 and 88 percent, CLS at 92 and 85 percent. So on these platforms the Core Web Vitals problem is usually a loading problem, and the chapter measures which platforms have it, not why. What closes it on a given store is a question its own field data answers.
A pass rate is not a verdict on your store. It is the distribution yours sits inside, and it matters before anyone quotes you a number for closing the gap. What each platform decides for you and what is left over is what Shopify decides for you on one side and ecommerce SEO on the other.
Core Web Vitals vs PageSpeed score: the difference
The number at the top of a PageSpeed Insights report is a Lighthouse performance score out of 100. That score is a weighted blend of lab metrics. The blend is not one of the Core Web Vitals, it is not what Search Console grades, and it can move in the opposite direction to your assessment.
A score out of 100 is not a pass mark.
The second mix up is treating page experience as a lever on its own. Google’s own wording settles it: Search always seeks to show the most relevant content, even if the page experience is sub-par. The same page adds that there is no single page-experience signal. So a fast page does not outrank a more relevant one, and there is no single number to move. Speed is worth the work for what it does to the visit; treating it as a lever on position claims more than Google does.
Core Web Vitals in an ecommerce SEO audit
Where these thresholds sit in a full technical review is covered in our guide to running an ecommerce SEO audit, along with the checklist items that have no published pass mark at all.
That guide sorts an audit by what kind of evidence sits behind each finding, and this is the one finding that has a number.
Open Search Console before you open anything else, go to the Core Web Vitals report, and read which URL group is failing and how many URLs sit inside it. That count is how many pages share the failing verdict. It is not how many one fix would move. Google groups by measured experience and your fix lands on a template, and the two overlap without being the same set. The count tells you whether you are looking at a page problem or a catalogue one.
Turning your failing URL group into a list of template fixes, in the order that clears the verdict, is our technical SEO service.
Sources
- web.dev Defining the Core Web Vitals metrics thresholds: why each threshold is measured at the 75th percentile of page views
- web.dev Web Vitals: the three metrics, their good thresholds, and the 75th percentile rule
- Chrome for Developers Chrome UX Report API: the data is a 28-day rolling average of aggregated metrics
- Google Search Console Help Core Web Vitals report: URL grouping, the three status bands, and the worst-metric rule
- web.dev INP becomes a Core Web Vital on 12 March 2024, replacing FID
- HTTP Archive Web Almanac 2025 Ecommerce chapter, Core Web Vitals by platform, Figures 13.10 and 13.11 Dated 2025 with no month given, so its exact age is not knowable from the source.
- corewebvitals.io Why the Core Web Vitals 28 day delay is a myth: the window rolls daily
- DebugBear Core Web Vitals: your ranking is determined by the slowest 25 percent of visitors
- Google Search Central Page experience: Search always seeks to show the most relevant content, even if the page experience is sub-par; there is no single signal
- Vodafone Web Vitals case study: 31 percent LCP improvement, 8 percent increase in sales, 50/50 split test Measured 5 years ago, on a surface that has moved since.
Questions people ask
What are the Core Web Vitals?
Largest Contentful Paint, Interaction to Next Paint and Cumulative Layout Shift. Good is 2.5 seconds, 200 milliseconds and 0.1 respectively, measured at the 75th percentile of real visits, not as an average.
How to pass Core Web Vitals assessment?
The optimisation work is the second half of the answer. The first half is knowing what you are graded on. The slowest quarter of your visits, collected over a rolling 28-day window, scored as a group of similar pages and not page by page.
That changes the order of work. Fix the template, not the page. Judge it on field data, not a lab score. And expect the first improved visits to enter the window within about two days, not after a month.
What does Google’s Core Web Vitals assessment measure?
Real visits from real Chrome users, collected in the Chrome UX Report. It is not a simulation. A page can score 95 in a speed test and sit in a failing group at the same time. The test runs once on a machine you do not own; the assessment is built from real visits on devices you do not control.
Are Core Web Vitals still relevant?
Yes, with two qualifications. Three metrics, and one changed: Interaction to Next Paint replaced First Input Delay on 12 March 2024, so any guide still listing FID is out of date. Google qualifies the weight in its own wording. Search always seeks to show the most relevant content even if the page experience is sub-par, and there is no single page-experience signal. That is a smaller claim than the one usually made for it. The work still pays, through the visit instead of the position.