

What is A/B testing?
Split your visitors at random, show one group the current version and the other a change, then compare. That definition is settled and it is not the hard part.
The definition is not where tests fail.
NORTHAM
Daily Greens, 30 servings
$50
Purchase options
- Cancel any time
- Free returns within 30 days
That is what a test is for. Every line in that box is a decision somebody made. The one above is the kind nobody in the room can call in advance. Taking the one-time option away might lift subscriptions, or it might cost you the people who wanted one box.
Tests fail in execution. The split does not come out the way it was configured. The tool measures something other than what you think. The result gets read before the test finished. Or the thing that moved was the novelty, not the change. Those failures do not announce themselves. A broken test produces a number that looks exactly like a working test’s number.
Common A/B testing failures
| What a guide explains | How many guides explain it |
|---|---|
| What an A/B test is | All six |
| How to split the traffic | All six |
| How to check the split came out right | One of them, Kameleoon |
| What an A/A test is for | One of them, Kameleoon |
| Whether reading a result early invalidates it | None of them |
| When not to run a test at all | None of them |
The vendors selling testing tools answer "what is an A/B test". Far fewer answer "how do I run one without fooling myself".
That second question is the harder one, and it is where most of this goes. Whether to test at all, how many of your ideas will win and what the programme costs is a different one, answered in our guide to conversion rate optimization.
Choosing the unit of randomisation
Before anything else comes the unit of randomisation. You can split by session, by browser cookie or by logged-in user, and the choice changes what the result can mean.
The split unit and the metric denominator have to match.
If you split by session, a returning shopper can see version A on Monday and version B on Tuesday. Their behaviour is then a mixture of both, and the comparison is diluted. If you split by cookie, the same person on a phone and a laptop counts as two people. If you split by logged-in user, you only cover the ones who log in.
| Split unit | What one unit is | Where it breaks |
|---|---|---|
| Session | One visit | A returning visitor sees both versions |
| Cookie or device | One browser | One person on two devices counts twice |
| Logged-in user | One account | Only covers signed-in traffic |
That rule is the same one behind what a conversion rate is: before two people can compare a rate they have to agree on what it divides. The consequence is the same here, because two teams using the same word can be measuring different populations.
This is the part of the setup that cannot be fixed afterwards. Sample size can be extended, a metric can be recalculated, but a test that split on the wrong unit has to be re-run.
Validity checks before you read the result
Splitting on the right unit is necessary and it is not enough. A test result answers the question you asked only if the test itself worked. There are two cheap ways to find out. Use both checks before reading a result. What remains unanswered is how often these checks fail in small ecommerce programmes, and what each one cannot catch.
First: did the split come out the size you asked for.
Microsoft Research, read 2 September 2026How often the split itself is broken in serious programmes
Addition’s own summary. Microsoft writes that “every analysis that is part of an ongoing A/B test using ExP first needs to pass this test before we reveal the actual results.” A store without that gate is not running fewer broken tests, it is finding out about fewer of them.

As we mention above, every analysis that is part of an ongoing A/B test using ExP first needs to pass this test before we reveal the actual results of the experiment. The threshold that we use is conservative to reduce the likelihood of false positives: p-value < 0.0005.
Microsoft Research, Diagnosing Sample Ratio Mismatch in A/B Testing read 7 September 2026
- Microsoft does not treat this as advice. No result is revealed until the split passes the check.
- The threshold is published too: a p-value under 0.0005, set deliberately low so the gate does not cry wolf.
The check is arithmetic you can do yourself. Take the number of visitors in each group, compare against the split you configured, and ask how likely that difference is by chance.

When the check fires
When the check fires, the fix is not to rebalance the numbers. Microsoft’s account of an MSN experiment shows why.
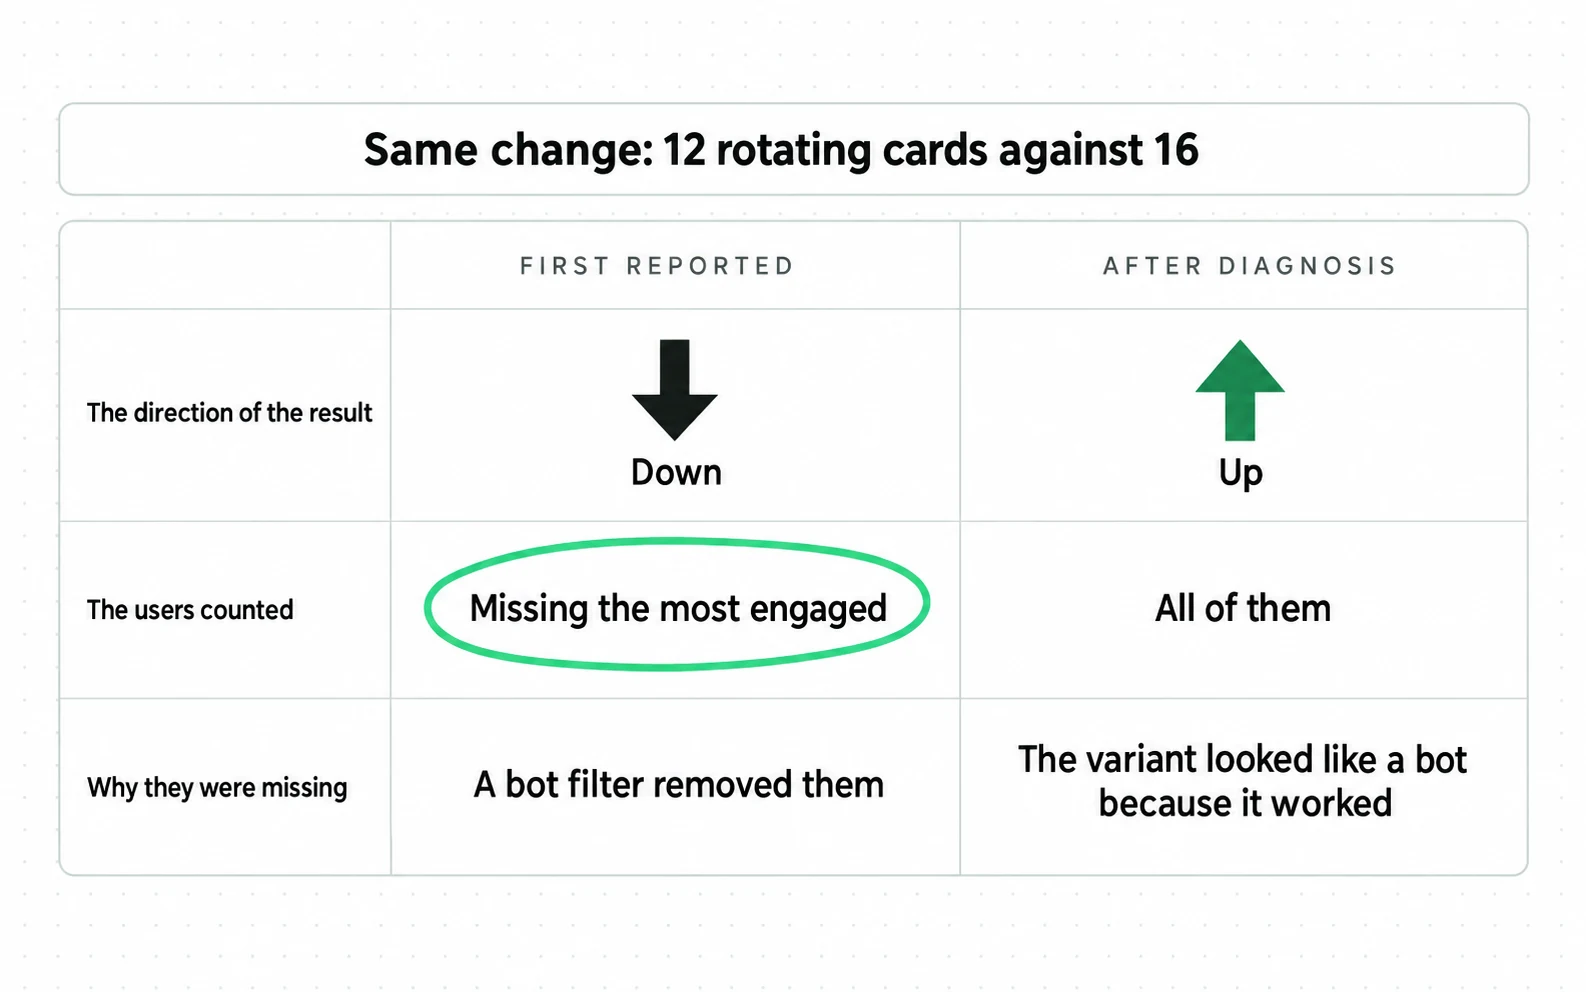

Second check: run an A/A test
Second: run an A/A test. Show both groups the same thing and see what your tool reports. Since nothing differs, any significant result it produces is a false positive. An A/A test catches a broken split or a metric wired to the wrong event. It does not measure your tool’s error rate. As the calculator above shows, twenty runs at a 95 percent threshold are expected to produce about one significant result on their own.
A/B testing mistakes that survive validity checks
A test can pass both of those checks and still report something untrue. These failure modes come from LinkedIn’s published research on the automatic detection it built for its own experimentation platform. That is evidence they are worth catching, not evidence of how often they happen. That research does not publish an incidence rate.
Stopping early is the one with a paper written about it.
Watching a test and stopping when it looks significant is not impatience, it is a different statistical procedure from the one the p-value assumes. Johari, Koomen, Pekelis and Walsh put it directly: frequentist p-values and confidence intervals are "wholly unreliable if users endogenously choose samples sizes by continuously monitoring their tests". Their answer was always-valid p-values, built for exactly this, and the paper reports the method implemented in a large-scale commercial A/B testing platform.
So the choice is a real one, not a scolding. Either fix the horizon before launch and do not look, or use a tool whose statistics are designed to be looked at. What you cannot do is use fixed-horizon statistics and peek anyway.
| Failure | Why it happens | What it does to the result |
|---|---|---|
| Design-imposed bias | The setup itself treats the groups differently | A difference that is not the change |
| Self-selection bias | Who enters the test is not random | The groups are not comparable |
| Novelty effect | People react to the change being new | An effect that fades after the test |
| Trigger-day effect | Users enter the experiment on different days | Groups measured over different periods |
Contentsquare read its 2026 digital experience panel and found conversion rate down 5.1 percent year over year while frustration signals fell 4.3 percent. Measured frustration signals fell while the conversion rate fell too.
Borrowing somebody else's benchmark instead has the same problem one level up. Ecommerce conversion benchmarks mislead because traffic source, business model and calculation method all differ between stores.
Fix the metric you will judge on before launch, not after you have seen which way it went.
None of these is caught by significance. A test can be perfectly powered, correctly split and stopped on schedule, and still be measuring novelty. Which is why some things are better fixed than tested.
How to run an A/B test
Everything above collapses into a sequence, and the order decides whether the result means anything. Four steps happen before a single visitor sees the change. The other two can wait, because nothing in the first four can be reconstructed once the data has arrived.
Six steps, and four of them happen before launch.
-
Write down what would disprove the idea
Not what would confirm it. If no result would change your mind, you are not running a test, you are running a demonstration.
-
Pick the split unit and the metric together
They have to be the same thing. This is the decision that cannot be fixed later.
-
Compute the sample and the stop date
Before launch, in writing. The arithmetic and why underpowered tests produce false winners are in the CRO method.
-
Run an A/A test if you have never sanity-checked the tool
Once per tool, not once per test. It catches a broken split or a miswired metric, which is a smaller claim than validating the statistics.
-
Check the sample ratio before you look at the outcome
The split first, the result second. Microsoft’s rule is not to trust the result of a test with a mismatch until you have diagnosed the cause, which is a diagnosis, not a discard.
-
Read the result at the horizon you set
Or use always-valid statistics, and know which one your tool gives you.
The programme around it is the ab-testing skill: ICE scoring, velocity and a playbook of your winners. Its sample-size table disagrees with its own reference file, and the item page tells you by how much.
Say you want the hypothesis and the arithmetic in one place. The experiment-design skill writes you the four-part hypothesis and refuses an underpowered test.
The first step is the cheapest of the four and the easiest to leave out, because nothing downstream refuses to run without it. A hypothesis that cannot be wrong will always be confirmed by something.
Step three is the one that decides whether the rest is worth doing at all, and it is arithmetic, not judgment. The CRO method works through what a given baseline and effect size demand, and what happens to your results when you launch below that number anyway.
A/B testing pricing after Google Optimize ended
That sequence needs somewhere to run, and one major free option ended on a known date. Know this before you price the work, because it retired Google’s free first-party testing tool.
Google Optimize was retired on 30 September 2023.
Google’s own notice states it plainly: Optimize and Optimize 360 are no longer available as of that date, and any experiments still active on it ended. Google’s stated reason was that the product "did not have many of the features and services that our customers request and need for experimentation testing", and that it would invest in third-party integrations for Google Analytics instead.
What that establishes is narrow: one widely used free first-party tool ended without a first-party successor. This is not a survey of what free or open-source alternatives exist today. It says nothing about what testing costs in general, or about who can still test.
We are not publishing a price table here. Vendor pricing for this category is mostly quote-based and we found no independent published range, and an invented one would be worse than none. What is stable enough to say is the shape: the statistics engine differs between vendors, and which engine you are on decides whether the peeking question above applies to you. Optimizely and VWO each publish an engine built to be watched while it runs. Check which engine your own tool uses before you decide whether you are allowed to look.
Your traffic decides the rest. If you sell to other businesses, the same sample requirement takes longer to reach, because it is a count of visitors and you have fewer of them.
B2B and SaaS CRO starts by asking whether your traffic can carry a test at all.
If your traffic does carry one, the page changes that follow are landing page optimization at Addition, a search marketing agency.
When should you not run an A/B test?
With the cost question bounded, the harder question is whether to run one at all. People keep asking it and rarely get an answer. It has one, and it is arithmetic, not opinion.
If you cannot reach the sample the effect requires, the test does not become a smaller test.
The scale is worth holding in mind. IRP Commerce’s July 2026 figures put the all-markets conversion rate at 2.26 percent. Detecting a small relative change on a baseline that size takes tens of thousands of visitors per variant. The exact number depends on the effect you want to detect and the power you want. That arithmetic, and what it does to your results when you launch below it, is worked through in the CRO guide.
| Situation | What to do instead of an A/B test |
|---|---|
| Not enough traffic for the sample the effect needs | Ship the change if it is unambiguously better; otherwise leave it |
| The change is a bug fix or a broken flow | Fix it. There is no hypothesis to test |
| The change is required by law or a payment rule | Implement it. The alternative is not a variant |
| You want to know why, not whether | Session replay, support tickets and asking people |
| The change is irreversible or affects price | Test it, and read the CRO sample size question first |
When a change is worth making without a test, look first at the form people are trying to finish. That is the subject of our guide to checkout optimization.
One check settles more arguments than any of the above: take your last completed test, count the visitors in each group, and check the split against what you configured. If the two numbers are further apart than chance explains, that result needs a cause found before it can be trusted, and finding that out costs one calculation.
Sources
- Microsoft Research Sample ratio mismatch in A/B testing: about 6 percent of Microsoft tests, about 10 percent of LinkedIn zoomed-in tests, and the MSN carousel result that reversed
- Johari, Koomen, Pekelis and Walsh Always valid inference: p-values are "wholly unreliable if users endogenously choose samples sizes by continuously monitoring their tests"
- Liu and colleagues, LinkedIn Automatic detection and diagnosis of biased experiments: design-imposed bias, self-selection bias, novelty effect and trigger-day effect
- Google Google Optimize and Optimize 360 are no longer available as of 30 September 2023, and active experiments ended on that date
- Kohavi, Deng and Vermeer A/B testing intuition busters, KDD 2022: the sample arithmetic and the false-positive consequences of low power
- Optimizely A/B testing glossary entry and statistics engine documentation, including sequential testing
- Kameleoon A/B testing guide: the only one covering sample ratio mismatch and A/A testing, and the one that says an unbalanced ratio means results will not be significant
- FullStory A/B testing guide, sixth organic result: covers sample size and significance, not validity
- Salesforce What is A/B testing: definition and process, second organic result
- Oracle What is A/B testing: definition and examples, fifth organic result
- VWO Bayesian sequential testing with Bonferroni correction in a commercial testing platform
- IRP Commerce Ecommerce market data July 2026: all-markets conversion rate 2.26 percent
- Google Analytics Data API schema: sessionKeyEventRate and userKeyEventRate as separate metrics with different denominators
- Hoenig and Heisey The abuse of power: the pervasive fallacy of power calculations for data analysis
- Contentsquare 2026 digital experience benchmark: conversion rate fell 5.1 percent year over year while frustration signals fell 4.3 percent
- The Good Why ecommerce benchmarks mislead: traffic source, business model and calculation method differ between stores
Questions people ask
What is an A/A test versus an A/B test?
An A/A test shows both groups the same thing. Since nothing differs, any significant result it reports is a false positive, not a finding. Run one when you adopt a tool, not before every test. Treat it as a sanity check on the plumbing, not a verdict on the statistics. At a 95 percent threshold you would expect roughly one significant result in twenty A/A runs even from a perfect tool.
When not to use A/B testing?
Skip the test in four cases. You cannot reach the sample size the effect requires. The change fixes something broken. Law or a payment rule requires it. Or the question is why, not whether. The first is the common case. On a 2 percent conversion rate, detecting a small change takes tens of thousands of visitors per variant. A test that cannot get there does not produce a weaker answer, it produces one whose reliability you have not established.
Is A/B testing the same as hypothesis testing?
An A/B test is an application of hypothesis testing, with two complications that the textbook version does not have. You usually watch the result arrive, which invalidates a fixed-horizon p-value unless the tool is built for it. And you usually look at several metrics, which raises the chance that one of them clears the threshold by luck.
Who uses A/B testing?
Microsoft and LinkedIn both run it as infrastructure, not as a project. Microsoft gates every experiment on a sample ratio check before analysis. LinkedIn built automatic detection for four common biases. One gap between that and a small store is traffic, since those programmes can detect effects a small store cannot. Another is that Microsoft reports a measured mismatch rate for its own experiments at all, which is not a figure most organisations publish.

