

What is product-led growth?
Product-led growth means the product does the selling, and that definition is not in dispute. What no definition prices is the thing being replaced, and that thing has a published price.
The product drives acquisition, retention and scale, sometimes with activation and expansion added. All of those versions claim the product does the primary work a salesperson would.
So the definition is settled. The decision is not, and it sits further down the B2B marketing funnel than the definitions suggest.
Check who is doing the defining before you weigh the agreement. A definition attached to a framework somebody sells is not independent evidence that the framework fits your business.
A definition that never names a failure case is a description, not a test. Treating product-led and sales-led as opposites is the other common framing, and this page argues with it.
Across the definitions, the shared claim is that the product can remove a salesperson from the purchase. A salesperson has a market price, and it is published every two years.
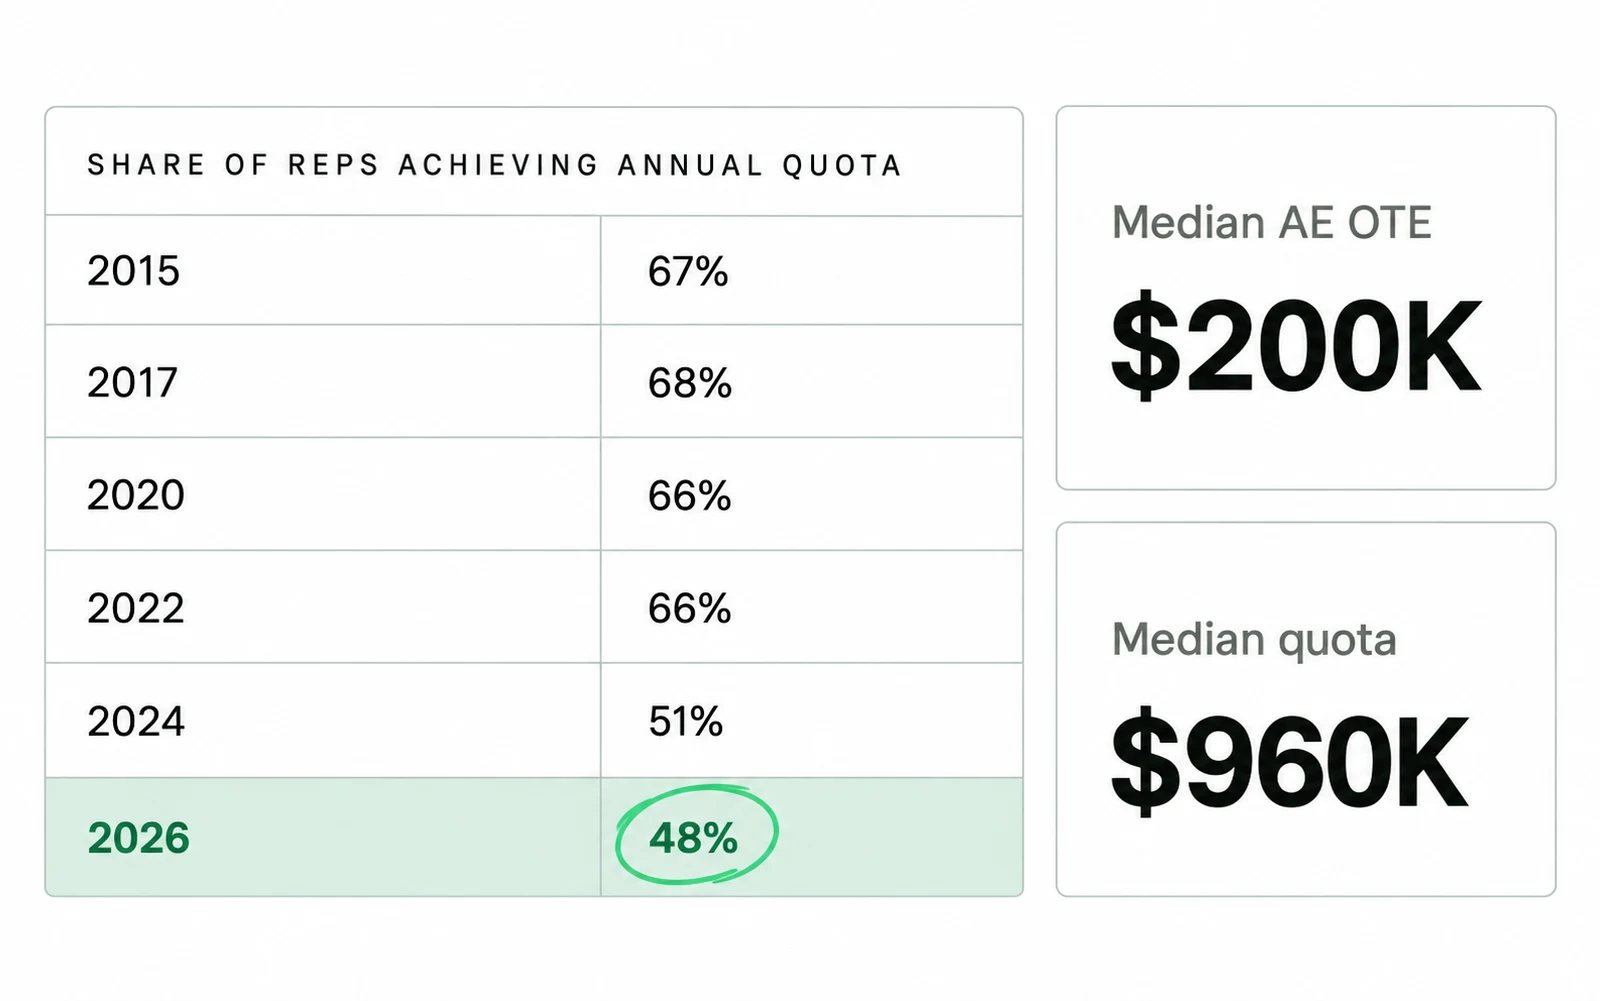
- Median account executive on-target earnings reached $200,000, up from $190,000 in 2024.
- Median annual quota is $960,000. The Bridge Group puts the quota-to-OTE ratio at 4.6x, up from 4.2x in 2024. Dividing the two medians gives 4.8; the page does not say how its 4.6 is calculated.
- Quota attainment fell to 48 percent in 2026, down from 51 in 2024 and from between 66 and 68 percent across 2015 to 2022.
Two numbers matter here and the second one is the lever.
On-target earnings tell you roughly what a rep is paid, and the employer cost on top is not published here. Quota tells you what a rep has to bring in for the arrangement to hold.
Divide that quota by your annual price and you get a customer count. That count is the whole decision.
What one sales rep must close
One account executive is expected to bring in $960,000 a year. At a high price that is a handful of deals. At a low price it is a much larger number, and seeing how much larger is the first useful thing this arithmetic does.
Customers per rep
The sum has one step. Take the median quota and divide it by what one customer pays you in a year.
What one quota looks like at four prices
Find the row nearest your own price. The gap between the top row and the bottom row is a hundred to one, and it is the reason the same advice cannot serve both.
Divide each of those by 250 working days. Sixteen deals a year is one every fifteen working days. Sixteen hundred is between six and seven every working day, closed one at a time, all year.
The same division runs the other way for anyone comparing this against B2B lead generation cost per lead, where the unit is a lead and the salary is still in the sum.
No published research prices the ceiling on deals one person can close in a year, and none is claimed here. Your own sales records hold that number, and the daily rate above is what you hold it against.
This reframes the usual question of whether you should choose product-led growth at all. Dividing first tells you what your price leaves available to choose from.
Signups behind the customers
Removing the rep does not remove the cost. It moves the cost to the top of the funnel, and the exchange rate there is published too.
Start: Freemium businesses have a median visit-to-signup rate of 6%, making website conversion optimization a huge opportunity. … Convert: Only 5% of all freemium signups convert from free to paid customers.
OpenView Third Annual Product Benchmarks, announced 7 June 2022 read 7 September 2026
- Only 5 percent of freemium signups convert to paid customers.
- Median visit to signup rate is 6 percent, so the traffic behind the signups is another multiple again.
- Companies that contacted their users retained them 2 to 3 times better, which is the first crack in the pure version of the model.
Now take the customer counts from the chart above and divide each one by that rate.
What replacing one rep costs in signups
At a 6 percent visit-to-signup rate, the top row needs over half a million visits a year to stand up.
Run the arithmetic on your own price
Four inputs, and three of them are already in your billing system. Run this before you rebuild anything, because the answer often removes the question.
Six steps, in order.
-
Write down your annual price
What one customer pays you across twelve months, at the plan most of them buy. Not the enterprise tier on the pricing page.
-
Divide 960,000 by it
That is how many customers one salesperson would need to close to carry a median quota. Divide it again by 250 working days to see the daily rate the job implies.
-
Find your own conversion rate
Divide the paying customers who came from last year's signups by the total number of those signups. With no free tier there is no rate yet, and the published 5 percent measures freemium products only, so borrowing it would answer a different question.
-
Divide the customer count by that rate
You now have the annual signups the product would need to do the work of one rep. Compare it against what you got last year.
-
Price the traffic
Divide the signups by your visit-to-signup rate to get visits, then price those visits at whatever acquisition costs you today. Compare the shape against the SaaS marketing funnel if you want the stage names. That is the real bill.
-
Check what the visits land on
The signup rate in step three is a property of the page as much as the traffic. A SaaS landing page has its own published median, so a low rate may be the page and not the market.
-
Compare the two bills
One salesperson at $200,000 of on-target earnings, before whatever employer costs sit on top, against the traffic bill from step five. Neither figure is published for your business, so this is the step where your own numbers decide it.
Read this for shape, not for a verdict.
At a low price the daily deal rate is the first thing to weigh, before any cost comparison starts. At a high price the deal count stays small and the comparison becomes a straight cost question.
Nothing published here says where the crossover sits, because the missing input is yours: what one signup costs you to buy. This division narrows the question to that one number, and then hands it back.
Free-to-paid conversion rates
The 5 percent figure is used as though it were a constant. That figure is one measurement of one model in one year, and the published spread around it changes the arithmetic by a factor of ten.
Six published conversion figures, and what each one counted.
| Source and year | What it measured | Rate |
|---|---|---|
| OpenView, 2022, 450+ founders and CEOs | Freemium signup to paid | 5 percent |
| First Page Sage, 2025 | Freemium to paid, all categories | 2.6 percent |
| OpenView and Lenny's Newsletter, 1,000+ products | Self-serve freemium, the good band | 3 to 5 percent |
| Same collection, the strong band | Self-serve freemium, upper quartile | 6 to 8 percent |
| ChartMogul and Growth Unhinged, 2026, 200 B2B products | Median across all models | 8 percent |
| Same report | Trials that require a card | 30 percent |
Rows three and four are two bands from the same collection. The six rows overall cover six populations. That is how you can tell the six rows are six populations and not one series.
Read the bottom two rows against the top one. The reported 30 percent rate is six times the reported 5 percent rate, and the two studies measured different populations. Asking for a card is a product decision, made before any of this.
The mirror image of this sum is what account-based marketing costs, where the list is short, the price is high, and the person stays.
So the rate in step three of the checklist is not a benchmark you meet. It is a consequence of a choice you already made about how people start.
Where the human comes back
The purest reading of product-led growth removes people from the funnel entirely. The benchmark data disagrees with the purest reading.

Quadrupling a 5 percent rate takes 32,000 signups down to 8,000. Compare that against the cost of the people making the contact, and the sum from the checklist runs again with a different answer.
Suppose the signup half is cheaper for you to move: that is SaaS SEO agency work at Addition, a search marketing agency.
Reported outcomes for the mixed model, preserved as a secondary attribution.
| Measure | Pure product-led | Product-led with sales |
|---|---|---|
| Companies above $10m annual revenue running the motion | The minority | About 67 percent |
| Hitting the net revenue retention target | 58 percent | 67 percent |
When does product-led growth not fit?
Four failure conditions decide whether the model fits. A fifth comes out of the model above, and it is the one a founder is most likely to get wrong, because it looks like a preference and behaves like a wall.
Five conditions under which the product cannot carry the sale.
| Condition | Why it breaks the model |
|---|---|
| Value arrives after a long setup | A free user who has not reached value has nothing to convert on, and the trial ends first |
| The only advantage is the interface | Nothing stops a well-funded competitor copying it, so acquisition never compounds |
| No clear unit to charge for | Usage grows and revenue does not, which looks like adoption and reads like a flat line |
| The product needs support to run | Support cost per customer scales with signups, and the saving disappears |
| Your price is above a few thousand a month | A $960,000 quota is sixteen customers at $5,000 a month, so deal count may stop being the obstacle and the comparison turns into a cost question |
The first row deserves a number and the published one is weak. One threshold in circulation is ten minutes to first value, and sixty seconds for products launched into an agent-driven market.
No study sits behind either figure. Treat both as unsupported practitioner heuristics, and measure your own instead.
Client-work failure lists add qualitative conditions and no thresholds. These qualitative lists give you no threshold to hold your own product against.
A sixth failure has no threshold at all and shows up in every set of examples. Slack, Dropbox and Calendly are cited on most of these pages as proof the model works. All three had free distribution at a scale a new company cannot buy, so they explain the outcome and not the method.
Metrics to track after launch
Three numbers, and the third one is where most reporting goes wrong. The first two are already on every product dashboard in the category. The third has to be worked out once a year, and only that one answers whether a person belongs in your sale.
What to report, how often, and what it is for.
| Measure | Cadence | What it is for |
|---|---|---|
| Visit to signup | Monthly | The traffic bill from step five lives here, and it moves fastest |
| Signup to paid | Quarterly | Anything shorter carries too few conversions to read |
| Signups needed per rep-equivalent | Annual | The arithmetic above, rerun with your own two numbers |
Report the signup count beside the rate, every time. A 4 percent conversion on 200 signups and a 4 percent conversion on 20,000 are different facts wearing the same number.
If you split signups by behaviour before counting them, the unit you are counting is what a product qualified lead is, and the rate above will move for that reason alone.
Print the denominator.
Then rerun the division once a year. Your price changes, your conversion rate changes, and the answer to whether a person belongs in your sale changes with them.
Everything above the signup is a separate bill, and what B2B demand generation rests on is where that side gets measured.
The traffic side of that bill has its own arithmetic: how much a published article has to average before it replaces a salesperson is the subject of SaaS content marketing.
Sources
- The Bridge Group State of Sales: 2026 AE Models, Motions & Metrics Research, drawing on 158 B2B companies
- OpenView, via PR Newswire OpenView Third Annual Product Benchmarks Report, 7 June 2022, gathering over 450 product-led founders and CEOs
- fiscallion.io Freemium conversion rate in SaaS, collecting the published bands in one place
- OpenView, summarised by charliecowan.ai OpenView 2023 Product Benchmarks Report, summarising the sales-assist finding
- Harvard Business School Online How to Achieve a Product-Led Growth Strategy, 13 March 2025
- Userpilot Product-Led Growth Strategy in 2026, naming four conditions under which the model does not hold
- Leadfeeder Understanding Product-Led Growth, 4 August 2026, attributing 5 percent to OpenView
- ProductLed Product-Led Growth: What it means, examples and strategies, 2 August 2023
- Salesforce Product-Led Growth: How It Works, Examples and Strategy
- Pendo What is Product-Led Growth, with two Citrix conversion improvements
- Atlassian What is product-led growth, a page carrying no number of any kind
- Klor Consulting The Product-Led Growth Trap: Why B2B Tech Fails and How to Fix It
- Digital Applied Product-Led Growth 2026 Strategy Playbook, attributing hybrid retention figures to OpenView 2024
- Ortto Product-led vs sales-led growth: which is right for your SaaS business in 2026
- ProductLed Product-Led Growth Book, second edition, by Wes Bush
- ProductLed Build a Product That Sells Itself, the company home page ranking tenth
Questions people ask
What is product-led growth?
Product-led growth means the product acquires, converts and expands its own users, with the product as the primary driver of acquisition and conversion. A free tier or a free trial carries the work a demonstration and a proposal would otherwise carry.
What the definitions leave out is who the model suits, because most of them never raise the question.
What is a good free-to-paid conversion rate?
OpenView put freemium signup to paid at 5 percent, gathered from more than 450 product-led founders and CEOs in 2022. A later OpenView and Lenny's Newsletter collection of 1,000+ products puts the good band at 3 to 5 percent, the strong band at 6 to 8 percent.
Free trials convert higher, and trials that ask for a card higher still. A 2026 ChartMogul and Growth Unhinged collection of 200 B2B products reports a median of 8 percent across all models, and 30 percent where a card is required.
When does product-led growth not work?
When your price is high enough to pay for a person. The Bridge Group's 2026 research across 158 B2B companies puts the median account executive at $200,000 on target with a $960,000 quota. A $60,000 annual contract fills that quota with sixteen customers.
Four other conditions are published: value that only appears after a long setup, a product whose only advantage is its interface, no clear unit to charge for, and a product that cannot run without support.
Is product-led growth cheaper than hiring salespeople?
Not by default. The salesperson is replaced by traffic, and traffic has a price too. At OpenView's 5 percent conversion rate and a $600 annual price, one rep's quota needs 32,000 signups a year.
That is a marketing budget, not a saving. The question is which of the two you can buy this year.

