

What SaaS content marketing covers
SaaS content marketing is publishing material a software buyer uses while deciding, adopting or renewing: guides, comparisons, documentation and customer stories. The useful planning question is what you would fund instead of that work.
Use guides while buyers frame the problem. Comparisons help them choose an approach, while documentation helps customers finish work inside the product.
Start with your company's stage. An early company may need direct conversations to learn the problem before it can publish useful guidance at scale.
A later company can use content to answer repeated sales questions, support comparisons and help existing customers complete the work they bought the product for.
The Content Marketing Institute asked 1,015 B2B marketers between June and August 2025 what stops them. Creating content that prompts a desired action came first at 40 percent, and resource constraints second at 39 percent.
A longer topic list does not solve either challenge. Content Marketing Institute surveyed 980 B2B marketers in 2024, and 54 percent put resource constraints first. Plan the publishing pace around the people who can create useful material and move a buyer forward.
Match each buyer moment to a useful format and a decision metric.
| Buyer moment | Useful content | Decision metric |
|---|---|---|
| Framing the problem | Problem guide | Qualified visits per article |
| Comparing approaches | Category comparison | Visits that become signups |
| Comparing products | Product comparison | Sales conversations assisted |
| Starting implementation | Setup documentation | Successful activations |
| Expanding use | Workflow tutorial | Feature adoption |
| Renewing the product | Customer story | Renewals or expansion assisted |
A content plan also needs an alternative. Compare its cost and expected output with the sales, partnerships or product work that would receive the same money.
What mature SaaS programmes can show you
Zapier, Ahrefs and Hotjar show what mature content programmes can achieve. Use them to see what is possible, then plan your own article count, publishing pace and measurement date.
Semrush reported more than 2.6 million monthly organic visits for Zapier in May 2025. Ahrefs and Hotjar also have mature content programmes, but company-level totals do not set a useful target for your next article.
Set a target for each new article from your own price and conversion rates. Company-wide traffic gives you context. Your own economics set the operating target.
Ahrefs found that 22 percent of top-ten pages were less than a year old. A new page can rank inside a year, but age alone does not tell you when the programme will recover its cost.
Programme payback depends on publishing volume, cost and the value of each conversion. Our guide to what B2B content marketing costs works through that calculation.
A second Ahrefs study examined around 14 billion pages in its Content Explorer index. It found that 96.55 percent received no Google traffic.
For example, if you plan forty articles this year, model the risk that most earn no Google traffic. Then decide how many weak pages you can afford to revise or remove.
Content or a salesperson: what each must produce
You can reach the same buyer by hiring a salesperson or by publishing. A salesperson carries a salary and a quota. Content has to earn enough traffic and signups to produce the same revenue.
The Bridge Group's 2026 research across 158 B2B companies puts the median annual quota at $960,000. Divide that quota by your annual price. A $50 monthly product requires 1,600 customers, while a $5,000 monthly product requires sixteen.
Two conversion benchmarks turn those customer counts into traffic. OpenView's 2022 median free-to-paid rate is 5 percent. Charlie Cowan's summary of OpenView's 2023 benchmarks puts the median visit-to-signup rate at 6 percent.
Our guide to what product-led growth costs in traffic works through the full chain. Next, divide the required traffic by the number of articles producing it.
Omid Ghiam uses fifty articles as the point when results start to show, based on his work at Webflow and on his own site. Use your funded article count in the calculation.
What one article has to average to replace one salesperson
The top row and the bottom row are the same programme against the same quota. The only thing that changed is the price of the product.
The lower-priced product needs far more traffic from every article. Compare the threshold in your row with the middle-performing page in your analytics.
Work out your own row
The chart above uses four prices, but your own price is the one that decides the comparison. Calculate your row with your quota, conversion rates and funded article count.
If writing wins the comparison, start with the buyer question, evidence and next action. The write-content skill turns those inputs into a draft.
-
Take your quota
Use the annual revenue one salesperson is expected to bring. The Bridge Group's 2026 median is $960,000. Our guide to what product-led growth costs in traffic works through it. Divide the quota by your annual price per customer.
-
Convert to signups
Divide the customers by your own free-to-paid rate. If you do not have one, use OpenView's 2022 median of 5 percent. Replace it as soon as your product has enough data.
-
Convert to visits
Divide the signups by your visit-to-signup rate. Charlie Cowan's summary of OpenView's 2023 benchmarks puts the median at 6 percent. Use your own analytics when you have enough data.
-
Divide by your article count
Use the number you are willing to fund and keep funding. Omid Ghiam uses fifty as the point when results start to show.
-
Compare against your middle page
Open your analytics and sort landing pages by organic visits. Use the page in the middle of the list because the top performer will overstate what a new article is likely to become.
What happens next depends on the page visitors land on. The SaaS landing page baseline covers that step. If your middle page clears the threshold, writing wins the comparison. If it produces only a tenth of the required visits, fund the alternative at your current price.
What fifty articles costs to find out
Price the writing for fifty articles before they earn traffic. Add editing, design and research to see what the programme costs before you approve it.
Omid Ghiam puts freelance rates at five cents to over a dollar a word, with content services around ten cents. At fifteen hundred words, his middle rate produces a $150 writing bill per article.
The writing bill before anything is known
Editing, graphics, keyword research and the wait for rankings are extra.
You pay the writing bill before the articles earn traffic. Add the support costs, then compare the full amount with the revenue threshold from your own row.
A content backlog with the rate applied to each rowPrice your own content backlog
Take the rate per word from your writer and the article count from your plan. The priced backlog becomes a budget line someone can approve.

For a fuller costing, see our guide to what B2B content marketing costs.
Compare this planned writing bill with our SaaS SEO service before approving either route.
Four SaaS content marketing mistakes to check first
Four mistakes can make a reasonable writing bill produce a weak programme. Check them before the work is old enough to make the problem expensive.
Four habits and the cost each one hides.
| Habit | What it hides |
|---|---|
| Copying the roadmap from a company at a different price | How much traffic your own price requires from each article |
| Counting articles instead of visits per article | A programme that grew in size while its output per page fell |
| Treating the first six months as the measurement | Whether enough articles have had time to reach buyers |
| Quoting a category statistic without its source | Whether anyone can check where the number came from |
Leave a category statistic out of the budget unless you can reach the original study. An attribution printed on a marketing card is only a lead to follow.
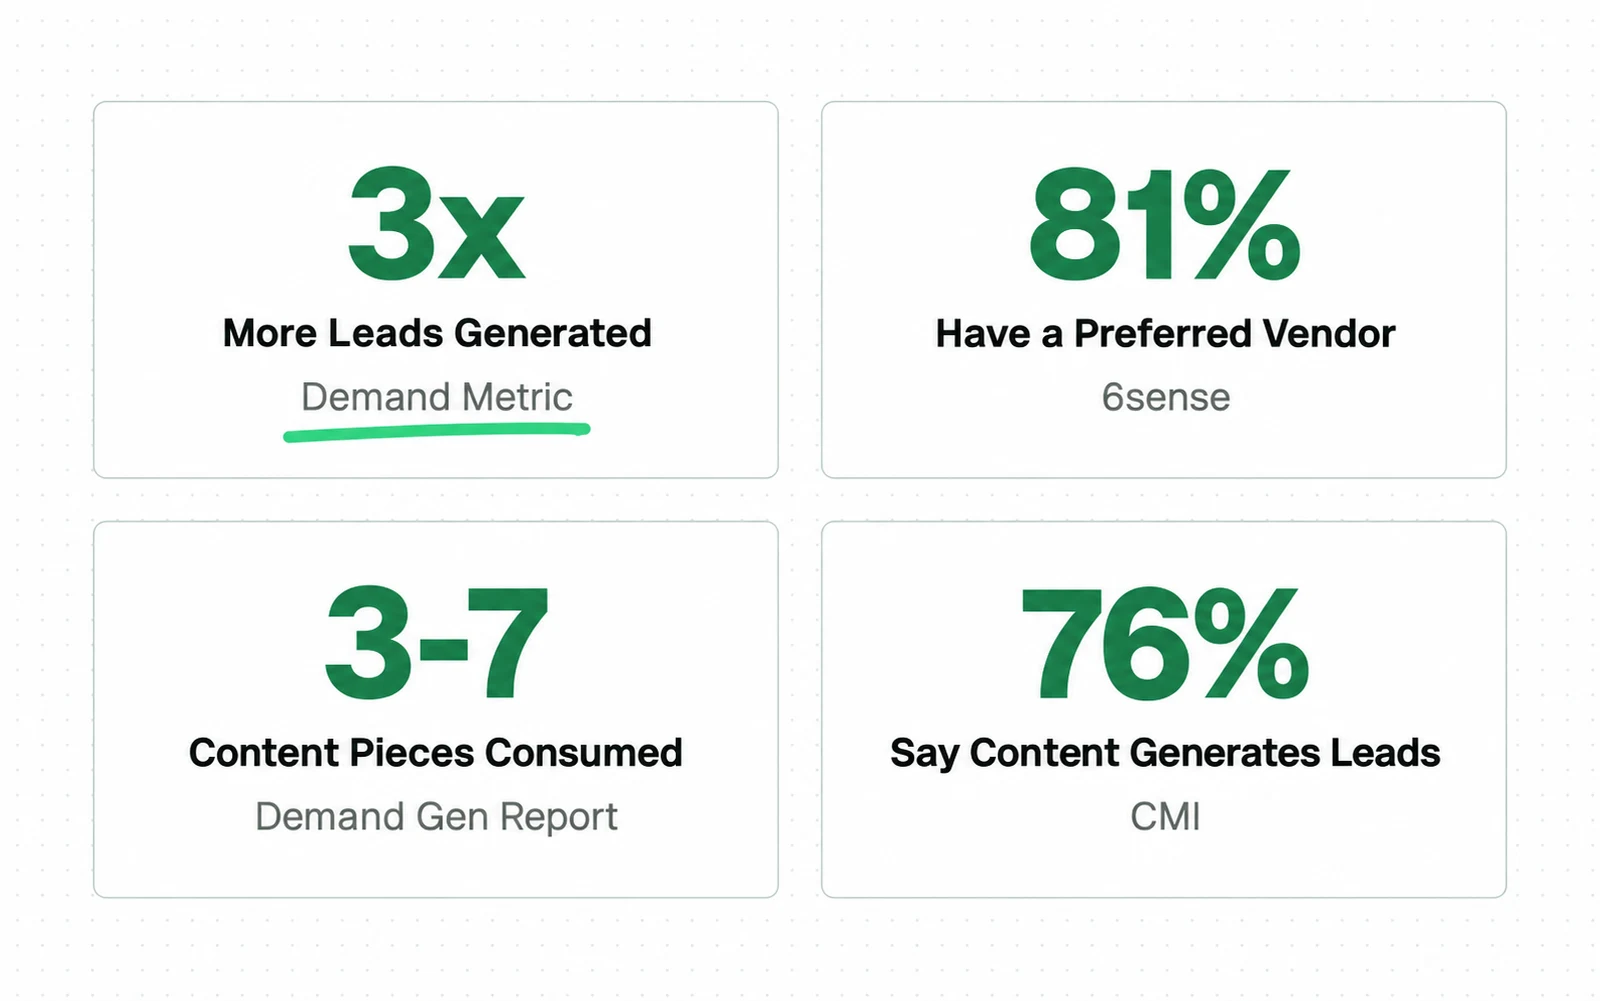
- Open the named source and look for the original study.
- Record the sample, date and method before the number enters a budget.
Record enough information to reproduce every budget claim.
| Claim type | Required record |
|---|---|
| Research finding | Publisher, date, sample and method |
| Calculated threshold | Inputs, formula and owner |
For example, a cost-saving claim needs the original spending data and the method used to compare alternatives. A copied percentage cannot supply either one.
Measure visits per article and total visits
The budget also needs an output measure. Total traffic rises while a content programme keeps adding pages, so track organic visits per published article beside it.
Track organic visits per published article beside total traffic. The average falls when a programme adds pages faster than they earn visits. Our SaaS marketing funnel guide covers where those visits go next.
New pages take time to lift that average. Ahrefs followed 1 million random URLs first seen by its crawler in September 2023. After a year, 1.74 percent had reached the top 10.
The same study found the average number one page five years old, and 72.9 percent of the top 10 older than three years. Your per-page figure will look bad for longer than your budget cycle.
Search behaviour can move the average even when your pages do not change. Pew Research Center logged 68,879 Google searches by 900 US adults in March 2025. Visits produced a click 8 percent of the time with an AI summary and 15 percent without one.
Read visits per article over a rolling quarter because month-to-month growth is uneven.

What to report, how often, and what it answers.
| Number | Window | What it answers |
|---|---|---|
| Organic visits per published article | Rolling quarter | Whether the programme is earning or just growing |
| Articles published | Monthly | Whether the threshold is reachable this year |
| Visit to signup rate | Quarterly | Whether the conversion in the arithmetic still holds |
| Cost per article, all in | Per quarter | Whether the bill matches the rate the plan assumed |
Sources
- Tim Soulo, Ahrefs 96.55% of Content Gets No Traffic From Google, 1 December 2023: around 14 billion pages in the Content Explorer index, 96.55 percent of them with zero Google traffic and 1.94 percent with one to ten monthly visits, and the study states its index leans toward higher quality pages
- Semrush SaaS Content Marketing: The 9-Step Roadmap for Success, 11 June 2025
- Marketer Milk My best SaaS content marketing strategy guide, by Omid Ghiam, 4 January 2025
- Kalungi Content marketing and SEO guide for B2B SaaS, 22 April 2025
- Instant SaaS Content Marketing: The Complete Guide to Organic Growth, updated January 2026
- The Digital Elevator 5 SaaS Content Marketing Examples to Use in 2026, updated 15 April 2026
- RevTek Capital SaaS Content Marketing Strategy, no date shown on the page
- Animalz How to Diagnose and Maintain the Health of a SaaS Blog, by Jimmy Daly, 1 July 2019
- Content Marketing Institute B2B Content and Marketing Trends: Insights for 2026, 1,015 B2B marketers out of 1,229 global responses, fielded 24 June to 14 August 2025, published 8 October 2025
- Content Marketing Institute B2B Content Marketing Benchmarks, Budgets and Trends 2025, 980 B2B respondents, fielded 25 June to 16 August 2024
- Ahrefs How long does it take to rank? 1 million random URLs first seen by the Ahrefs crawler in September 2023, plus 1.3 million random US keywords for page age, published 2025
- Pew Research Center Google users are less likely to click on links when an AI summary appears: 68,879 unique Google searches from 900 US adults, March 2025, published 22 July 2025
- The Bridge Group State of Sales: 2026 AE Models, Motions and Metrics Research, drawing on 158 B2B companies
- OpenView Third Annual Product Benchmarks Report, carried by PR Newswire, 7 June 2022, gathering over 450 product-led founders and CEOs
- OpenView, summarised by charliecowan.ai OpenView 2023 Product Benchmarks Report, summarising the conversion medians
Questions people ask
What is SaaS content marketing?
Publishing material a software buyer uses while deciding, adopting or renewing: guides, comparisons, documentation and customer stories.
To judge whether it is worthwhile, compare its expected return with the alternative use of the same budget.
Can you provide some examples of SaaS content marketing?
A problem guide can help a buyer frame a need. A category comparison can help them choose an approach. Setup documentation can support activation, while a workflow tutorial can increase feature adoption.
Choose the buyer moment first, then give the page a metric tied to that moment.
How long does SaaS content marketing take to work?
Ahrefs followed 1 million random URLs first seen in September 2023. After one year, 1.74 percent had reached the top 10.
Plan with an article count and publishing pace because those inputs determine how much work has had time to rank.
Is content marketing worth it for early stage SaaS?
It depends on your price. Using The Bridge Group's $960,000 quota, OpenView's 5 percent median, Charlie Cowan's 6 percent median and Omid Ghiam's fifty-article assumption gives a large spread.
A $50 monthly product needs about 890 organic visits per article each month. A $5,000 monthly product needs about nine. Work out your own row before choosing content or sales.