

What B2B demand generation covers
B2B demand generation builds awareness, interest and intent among buyers, most of whom are not yet ready to buy. It can stop at pipeline entry or continue through the sales stage.
Choose where your team draws that line before you write the business case. A programme that stops at pipeline entry is judged on the interest it creates. One that runs through the sales stage is judged on revenue.
Base the business case timeline on how long the B2B buyer journey takes in your own deals. A long journey pushes back the point where the programme pays for itself.
If the programme must turn interested prospects into sales conversations, define when B2B lead generation takes over.
How much buying happens before sales
Buyers do much of their research before sales gets involved, but no single percentage tells you how much. The four figures below count different things, from digital steps to sales conversations, so check what a figure measures before you use it.
Values from CEB and Google's 2011 study of 1,500 people at 22 companies, and from SiriusDecisions in 2013.
| Value | Publisher | Year | What it counts |
|---|---|---|---|
| 45% | CEB Marketing Leadership Council and Google | 2011 | The earliest point in the study: no company engaged a supplier rep before this |
| 57% | CEB Marketing Leadership Council and Google | 2011 | The average of 1,500 answers from people at 22 companies |
| 65% | CEB Marketing Leadership Council and Google | 2011 | The highest point in the study. Two companies out of 22 reached it |
| 67% | SiriusDecisions | 2013 | The share of the journey carried out digitally |
For example, if shortlisted buyers keep asking how long setup takes and who holds their data, publish an implementation timeline and a security summary before you ask for a sales call.
Measure first sales contact in your own deals before setting a target. The spread between 45 and 65 percent in the CEB and Google study shows how much company behaviour can vary around an average.
Where the 67 percent statistic came from
SiriusDecisions said 67 percent of the journey was digital in 2013. The figure does not mean buyers keep sales out until they are two thirds of the way through.
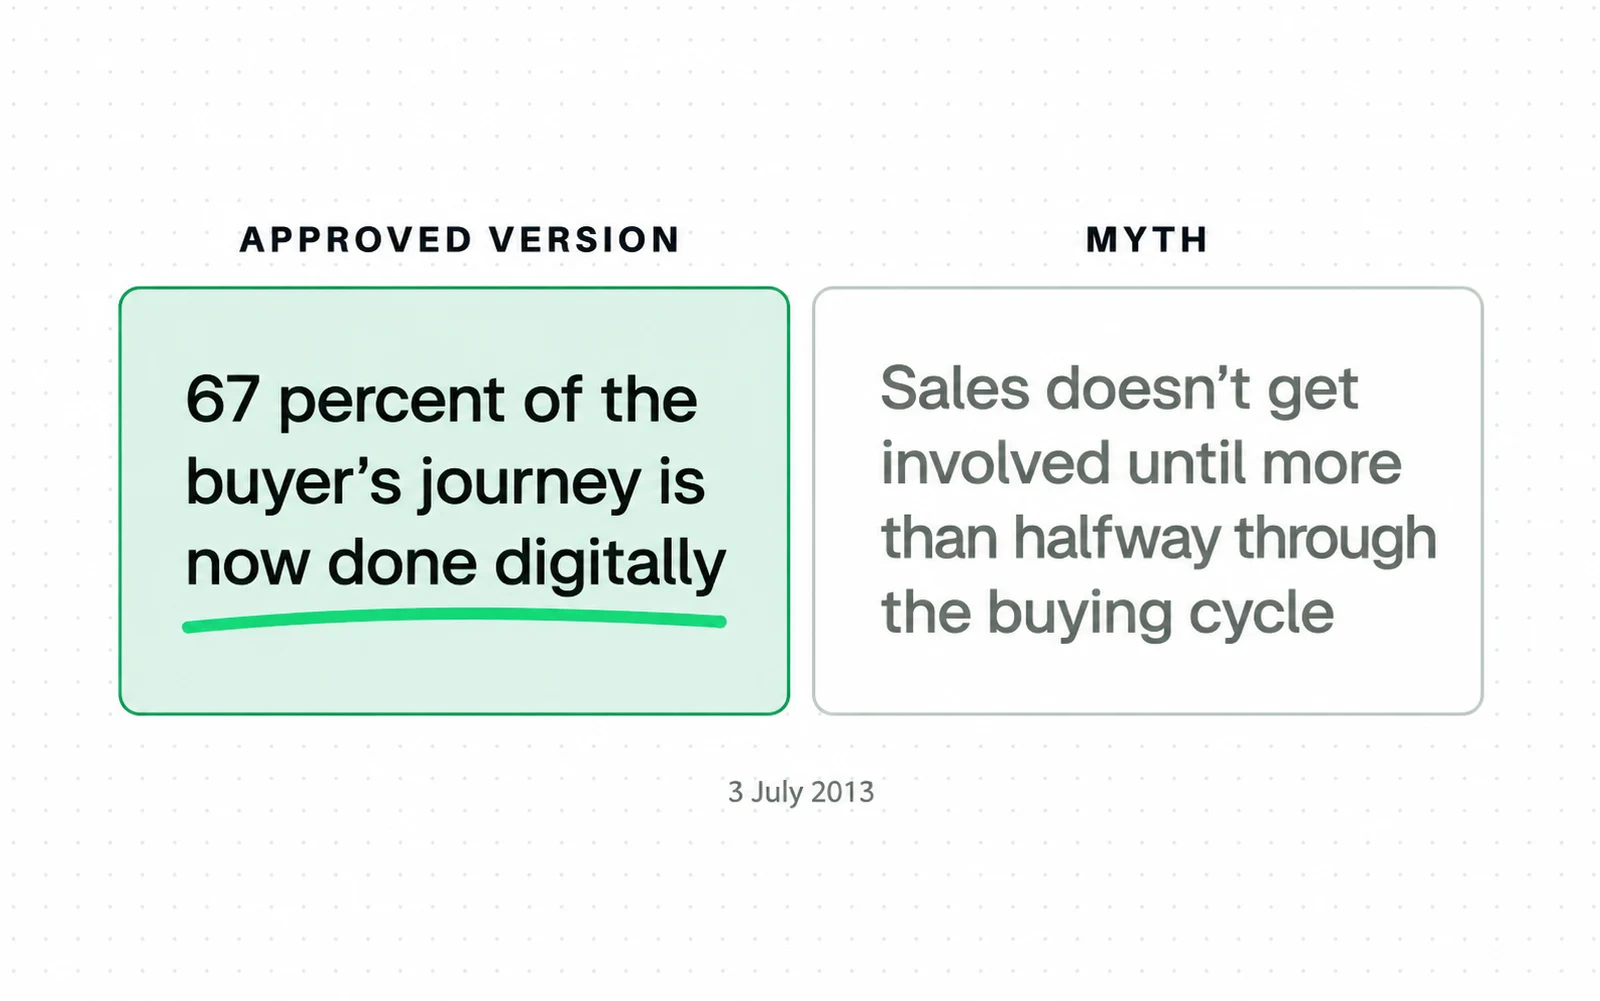
- Online research and sales contact happen side by side.
- Sales does not have to wait until buyers pass the halfway point.
-
Help sales join the conversation
Sellers need to offer something buyers cannot find online, such as an analysis of the buyer's company.
-
Reach buyers before they come to you
Heuer recommends account profiling, propensity modelling, segmentation and targeting. Use search and site activity to identify accounts that are starting to research the problem your product solves.
-
Help buyers evaluate the purchase
Publish vendor comparisons for buyers who are evaluating a purchase.
Plan for the whole buying group
Buyers rarely evaluate a purchase alone. Forrester's December 2024 State of Business Buying release reports 13 people in the average buying decision. Forrester says 89 percent of those purchases involve at least two departments.
| What it says | Who it credits | |
|---|---|---|
| INFUSE | "70% or more of the buyer's journey occurs before a prospect ever speaks to a sales representative" | 6sense, 2024 |
| Guideflow, first mention | "over 70% of the B2B buying journey now happens before a prospect talks to sales" | Gartner |
| Guideflow, a few paragraphs later | "Over 70% of the B2B buying journey happens before a prospect engages with sales" | Forrester research on B2B buyer self-directed purchasing |
| B2BNN | "Buyers complete approximately 70% of their purchasing process before ever engaging with a sales representative" | no source given |
List everyone who can approve or block the purchase, and everyone who will use the product. Give each person evidence for the decision they have to make.
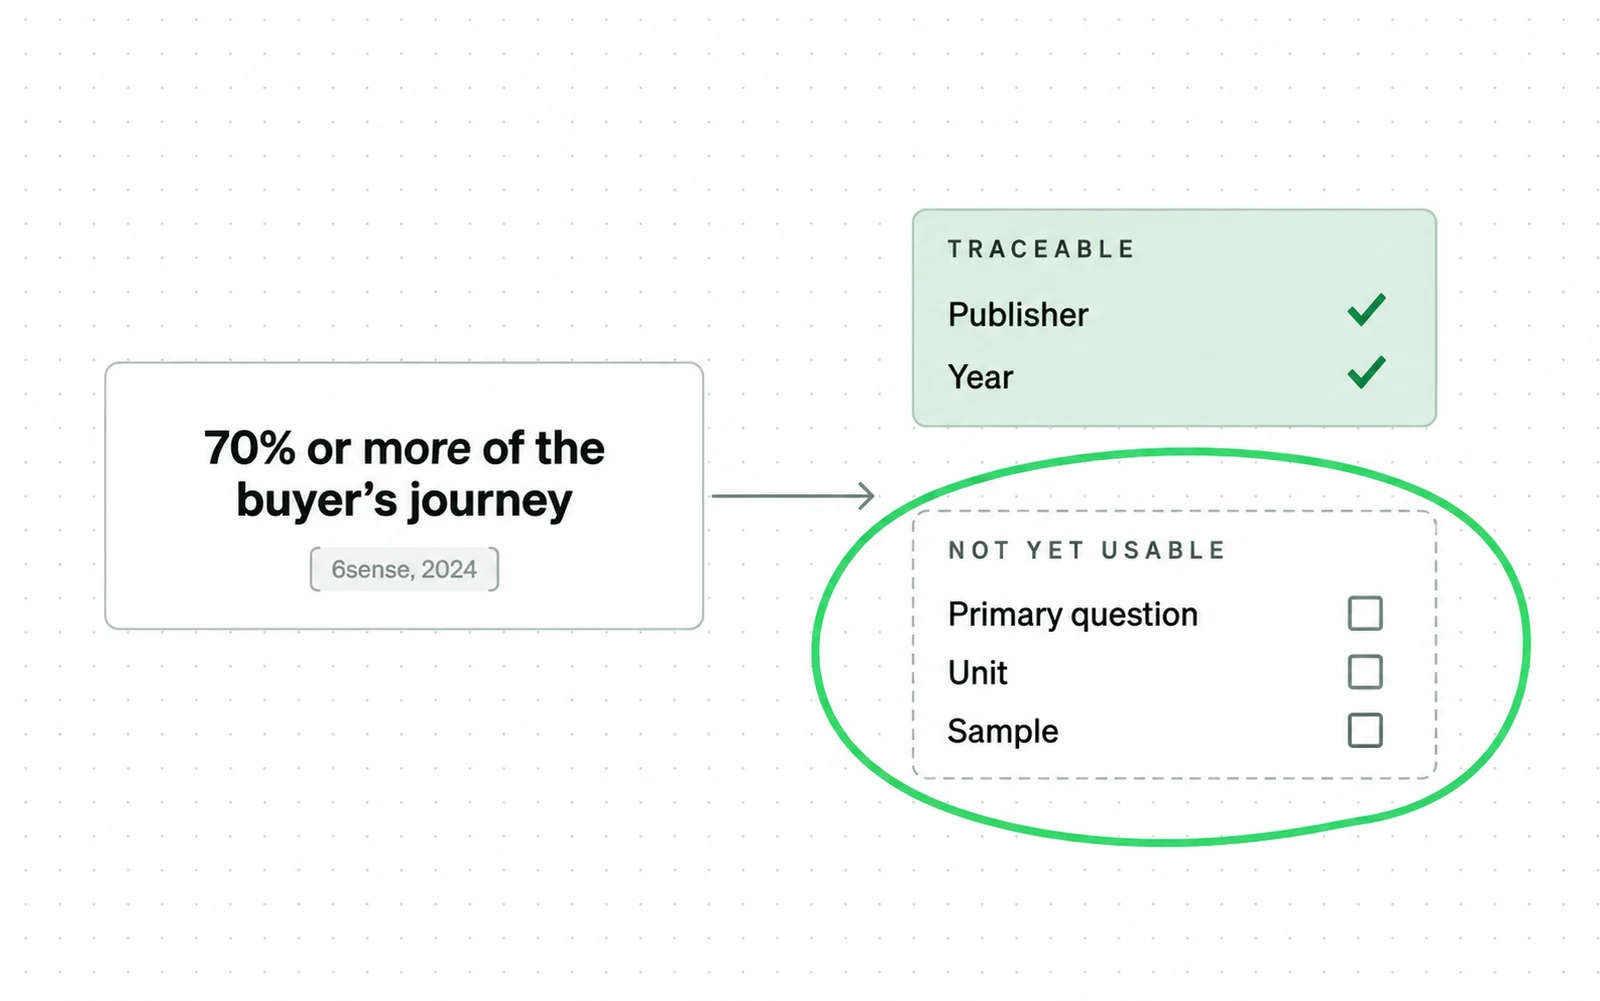
- The bracket names a publisher and year, so you can begin verification.
- You still need the primary question, unit and sample before using the figure.
Define whether your report counts individual leads, buying groups or opportunities. For example, if three people from one account fill in three forms, decide in advance whether that is three leads or one opportunity.
Forrester's B2B Revenue Waterfall tracks opportunities through connected buying groups. If you adopt that model, your report groups buyers from the same account under one purchase decision.
Who makes the first contact
6sense's 2024 survey of 2,509 B2B buyers found that buyers initiated first contact 80 percent of the time. Your sales team should expect a buyer who already has requirements and a preferred vendor.
Document how sales should respond to that buyer. Open with their requirements and their shortlist. Skip the introduction to the category.
B2B buyers are nearly 70% through their purchasing process before engaging with sellers
Demand Gen Report, Kelly Lindenau, reporting 6sense’s 2024 Buyer Experience Report 10 October 2024, read 7 October 2026
- Buyers still talk to sales. Most of the time, they make the first move.
- By the time they do, most of their research is done.
In the same 2,509-buyer survey, 6sense found that 81 percent had a preferred vendor at first contact. 6sense found that 85 percent of buyers had already set their requirements before first contact.
6sense put the average buying cycle at 11.3 months. It also reported an average of 11 people per buying group. Forrester reports an average of 13 people per buying decision.
Plan content for the larger group until your CRM shows how many people join your deals.
Ask buyers what led them to shortlist each vendor months earlier. Compare their answers with the marketing you were running at the time.
Reaching buyers before they shortlist vendors is a different job from lead nurturing, which starts once you know who the prospect is.
What to build when the buyer arrives already decided
To make a buyer's vendor shortlist, build awareness before they contact you. Most of that work happens months before anyone fills in a form. Reach the finance and security people in the buying group too, including those who do not download your content.
-
Start before the shortlist exists
Work backwards from the point when buyers set requirements and create a shortlist. Say your deals take about a year from first activity to signature. Start awareness work this quarter to reach buyers who will build their shortlist next year.
-
Write for the late stages too
Explain how implementation, pricing and security work. Publish pages that compare your product with the alternatives buyers shortlist. Collect the questions your sales team hears in the final weeks of a deal, then publish one page for each.
-
Give sales a reason to start conversations earlier
In the first sales call, use diagnostic questions, an analysis of the buyer's account and the tradeoffs of each way to implement. That gives buyers something they cannot get from your website.
-
Reach the full buying group
Track which people from each account engage at each stage of your B2B marketing funnel, and what role each one holds. When you hand an account to sales, say which roles engaged and what they read.
After the handoff, use your lead nurturing sequence to answer the buying group's remaining questions. Start from what those buyers have already read, so they do not have to repeat their research.
What a demand generation programme costs
Estimate how long the programme must run to give the buyers it reaches time to complete a purchase. Then budget for the people who produce content and support sales, plus media spend over that period.
Use your CRM to measure the time from a buyer's first recorded activity to the final purchase decision. Schedule the first programme review after that point.
Name the internal owners for audience research, content, media, sales enablement and reporting before deciding what to outsource. Then estimate the cost of outside help for any work that has no internal owner.
Include media spend when you calculate your B2B lead generation cost per lead.
Google Ads reported an average United States cost per click of 86.32 dollars for “b2b demand generation” in September 2026. At that rate, 100 clicks would cost 8,632 dollars before anyone submits a form.
Before the first campaign runs, write down what each channel must deliver. Give every paid channel a spending limit.
If you would rather not run paid search in house, our B2B PPC service runs it within the limit you set.
Five mistakes to check before planning
Review these five mistakes at the budget meeting, before any paid channel runs. Fixing one at that stage means editing a document. Fixing it after launch means months of spend aimed at the wrong buyers.
The first is quoting a percentage without saying what it measures. Label each figure with what it counts, so readers can tell vendor preference, online research and contact with sales apart.
The second is waiting for the buyer to arrive. Use the buyer roles and problems from your B2B buyer journey map to build a list of target accounts.
If you turn that list into an account-based marketing programme, check that the higher research and personalisation cost fits your budget.
The third is publishing only introductory material. Buyers later in the B2B marketing funnel then find no answers to the questions they ask before they buy.
Sort your published pages by stage. If you have no pages on implementation, security or price, write those pages first.
The fourth is judging the programme by the last click before a buyer submits a form. Early awareness work rarely gets that click, so a last-click report undervalues it.
The fifth is planning for one persona. For example, a security buyer may need technical proof while finance needs the cost case.
Decide which side MQL sits on before you report anything
Before you report anything, decide whether marketing qualified lead (MQL) volume belongs to demand generation or lead generation. Record the choice in the plan. Apply it in every quarterly report.
Choose the reporting model that matches which team owns MQLs.
| Operating choice | Demand generation measured by | Lead generation measured by |
|---|---|---|
| Demand generation owns MQL | MQLs, SQL progression, acquisition cost and pipeline contribution | Accepted MQLs, sales response and opportunity conversion |
| Lead generation owns MQL | Awareness, account engagement, buying-group coverage and pipeline influence | MQLs, SQL progression, cost per lead and opportunity conversion |
Ask sales to write down its MQL definition. Compare it with yours.
If the two differ, agree on what a marketing qualified lead is and what a sales qualified lead is for your company.
Write the agreed MQL and SQL definitions at the top of every report.
If your teams disagree about where demand generation vs lead generation responsibilities split, settle that first.
Then document how your lead scoring sorts each new contact into MQL or SQL. Base those rules on the difference between an MQL and an SQL your teams agreed.
Ask new customers how they first heard about you. Compare their answers with the source your tracking credited.
For example, if several buyers name a podcast your tracking never recorded, your report misses that channel's contribution to demand.
When buyer answers and tracking disagree, report both, and decide in advance which of the two sets your spending.
For each channel, agree on the one metric you will judge it by each quarter.
Sources
- Forrester The State Of Business Buying, 2024, press release 4 December 2024: "On average, 13 people within an organization are involved in the buying decision, with 89% of purchases involving two or more departments." The release does not publish its sample
- Forrester Transform Your Demand Process: the B2B Revenue Waterfall guide, which asks readers to "move beyond marketing-qualified leads (MQLs)" and describes "shifting from managing individual leads to identifying, prioritizing, and advancing opportunities with connected buying groups"
- SiriusDecisions Three Myths of the 67 Percent Statistic, by Megan Heuer, VP Research, 3 July 2013
- Demand Gen Report 80% Of B2B Buyers Initiate First Contact, Once They Are 70% Through Their Buying Journey, by Kelly Lindenau, 10 October 2024
- INFUSE What Is Demand Generation, which attributes 70 percent or more to 6sense 2024
- Salesforce What Is B2B Demand Generation, listing MQLs and SQLs as demand generation metrics
- monday.com B2B demand generation strategies, attributing 61 percent rep-free preference to Gartner
- Informa TechTarget The Complete Guide to B2B Demand Generation, citing 80 percent of tech buyers on shortlist sufficiency
- Cognism What is Demand Generation, naming CPA, customer lifetime value and cycle length as the three KPIs
- fullfunnel.io B2B demand generation: the ultimate guide, which reports its own first year twice with different figures
- MarketOne What is B2B demand generation, a definition page carrying no percentage at all
- Guideflow B2B demand generation: the complete guide for 2026, attributing the same 70 percent to Gartner in one paragraph and Forrester in the next
- B2BNN B2B Demand Generation: The Complete Strategy Guide For 2026, by Adam Tanton, 1 April 2026
- Demand Gen Report Publication home page, ranking for the term as a trade title, not as a definition
- Forrester The address that now answers for the three myths post, showing a B2B marketing section page instead
Questions people ask
How much of the B2B buying journey happens before sales?
No single percentage answers the question. A 2011 CEB and Google study put average first contact at 57 percent of the process. SiriusDecisions said 67 percent of the journey was digital in 2013.
The CEB and Google figure measures when buyers first contact a salesperson. The SiriusDecisions figure measures digital activity.
Where does the 67 percent statistic come from?
From SiriusDecisions in 2013. Its VP Research, Megan Heuer, described 67 percent of the buyer's journey as digital.
The figure does not mean buyers wait until halfway through the buying cycle to talk to sales.
Is demand generation the same as lead generation?
Demand generation builds awareness and interest across the market. Lead generation captures identifiable prospects.
Your team can run them together or separately. Either way, write down when lead generation takes over.
What should a demand generation programme report?
Report pipeline contribution, account engagement and buying-group coverage. Decide whether MQL volume belongs to demand generation before you set its target.
Ask buyers how they heard about you. Compare their answers with digital attribution.