

What is account-based marketing?
Published definitions of account-based marketing largely converge. Researchers have measured the same practice under another name since 1990, across 104 papers reviewed in the Journal of Business Research in 2023. Underneath the agreement sits one change that decides everything else: you stop counting leads and start counting companies.
Account-based marketing treats a named list of companies as the market. The practice targets and engages specific high-value accounts by name. Most published definitions are versions of that sentence.
The change underneath the definition is a measurement change. Ordinary B2B lead generation counts leads: individual people who raised a hand. Account-based marketing counts accounts, so five people from the same company are one number, not five.
The same month, read two ways.
| Question | Counting leads | Counting accounts |
|---|---|---|
| What is one unit | One person who raised a hand | One company, however many people it sends |
| Who sets the list | The campaign, after it runs | You, before it runs |
| What a good month looks like | 200 form fills from anywhere | Movement inside 11 of your 40 named companies |
| What gets ignored | Nothing, so small buyers inflate the number | Everything off the list, on purpose |
An ad account audience list, account levelWhere the change of unit becomes visible
The first two rows target a list of companies somebody chose by name. The rest target people who match a description. Reporting the first two with the counting rules of the last three is how a programme keeps its old numbers and its new label.

That distinction has a practical edge. A lead-counting team celebrates volume from companies it will never sell to, because a lead from a nine-person startup and a lead from a bank both add one.
An account-counting team cannot do that. The list is fixed before the campaign starts, so anything outside it does not register as progress. That makes the difference between an MQL and an SQL a smaller argument than it usually is.
Say you sell warehouse management software and forty companies in your region run warehouses big enough to need it. Under lead counting, a good month is 200 form fills. Under account counting, a good month is movement inside eleven of those forty.
That older name is key account management, and it carries its own literature. So the question of whether concentrating on a few named customers pays has been asked for three decades.
The answers there are more specific than the category guides suggest. Two of them are further down this page.
How many of your accounts are buying now?
One number decides the shape of your programme: the share of target accounts buying now. A target account list is not a pipeline. Multiply it by the share of buyers who are in the market right now, and you get the size of this quarter.
Three tiers
Start with the tiers, because that part is documented. A common framework splits the list three ways, with example account counts attached to each tier.
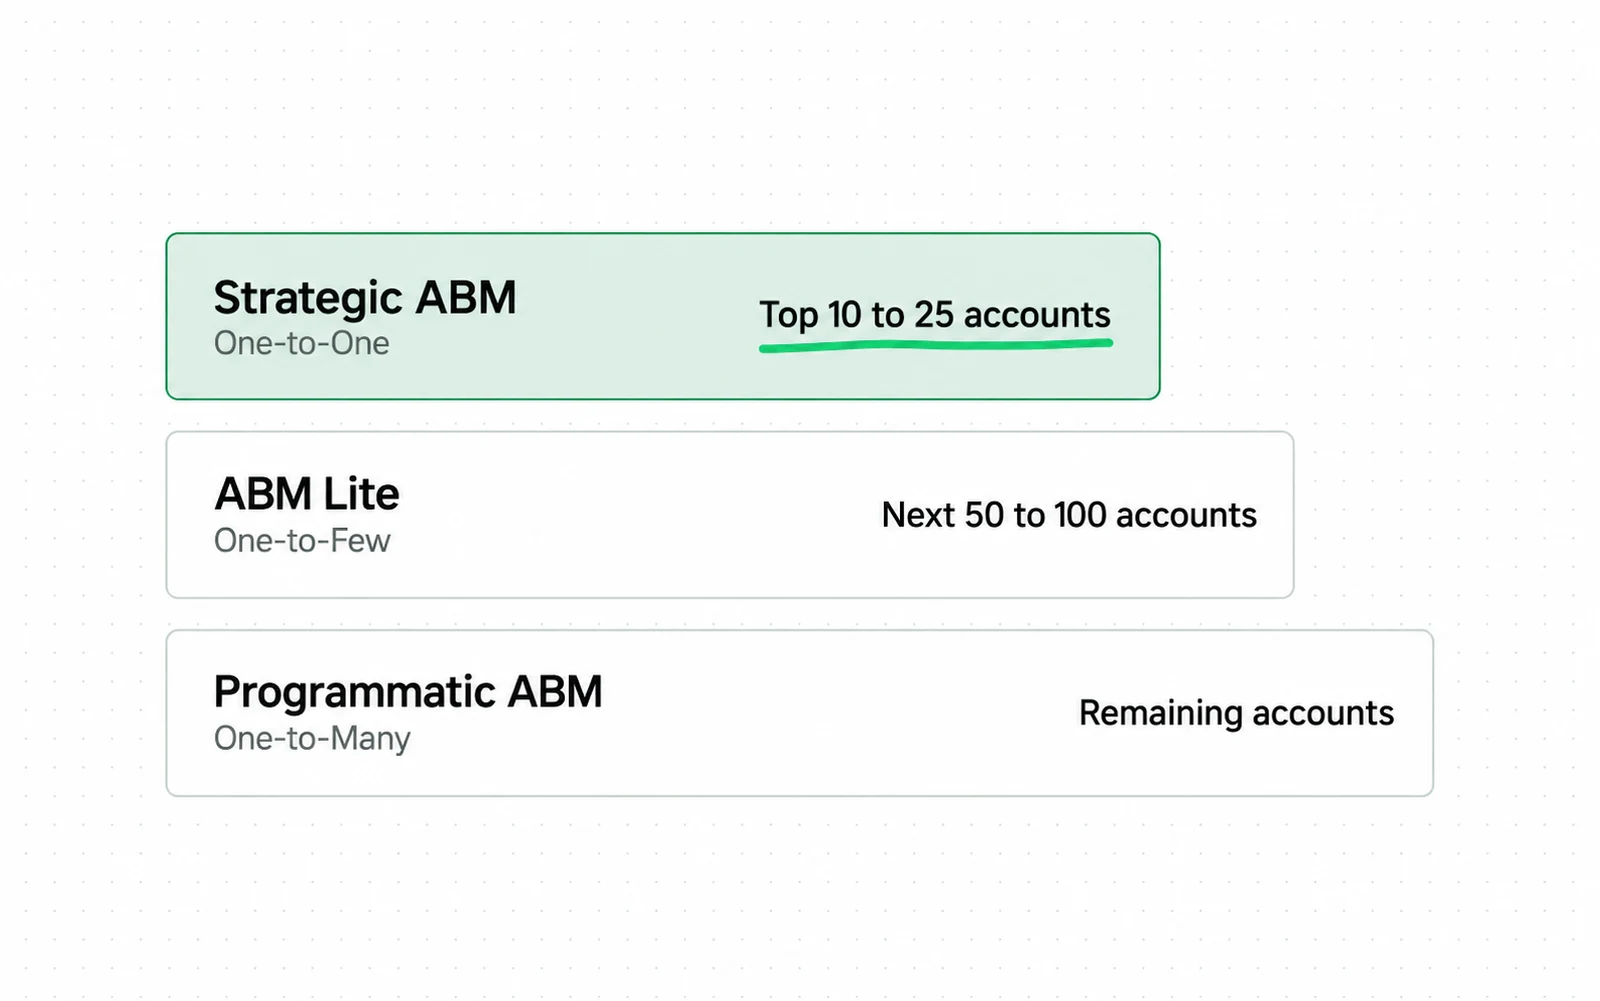
- Strategic work treats one company as its own market. It suits enterprise deals with long sales cycles and high contract values, which is the fit condition stated in words.
- Lite covers a cluster that shares a problem. One worked example covers 5 to 15 companies in one industry.
- Programmatic is the rest of the list, run through advertising and email at account level.
Buyers in market now
Now the missing number. Put a hundred companies on a list and it feels like a hundred opportunities, and it is not. Most of them will not buy anything in your category this year, whatever the B2B buyer journey looks like once they do.
John Dawes at the Ehrenberg-Bass Institute put a figure on that for the B2B Institute in 2021.
He started from a simple observation. Businesses replace a major supplier roughly every five years, so about 5 percent of the category is in the market in any given quarter.
The same arithmetic works across annual and quarterly windows. A five-year cycle gives you about 20 percent in a year and something like 5 percent in a quarter.
Same buyers. Two windows.
That distinction matters because the best-known challenge to the figure runs into it. Forrester analyst John Arnold published a post in May 2025 arguing that 5 percent is too low, and he has a measurement behind the argument.
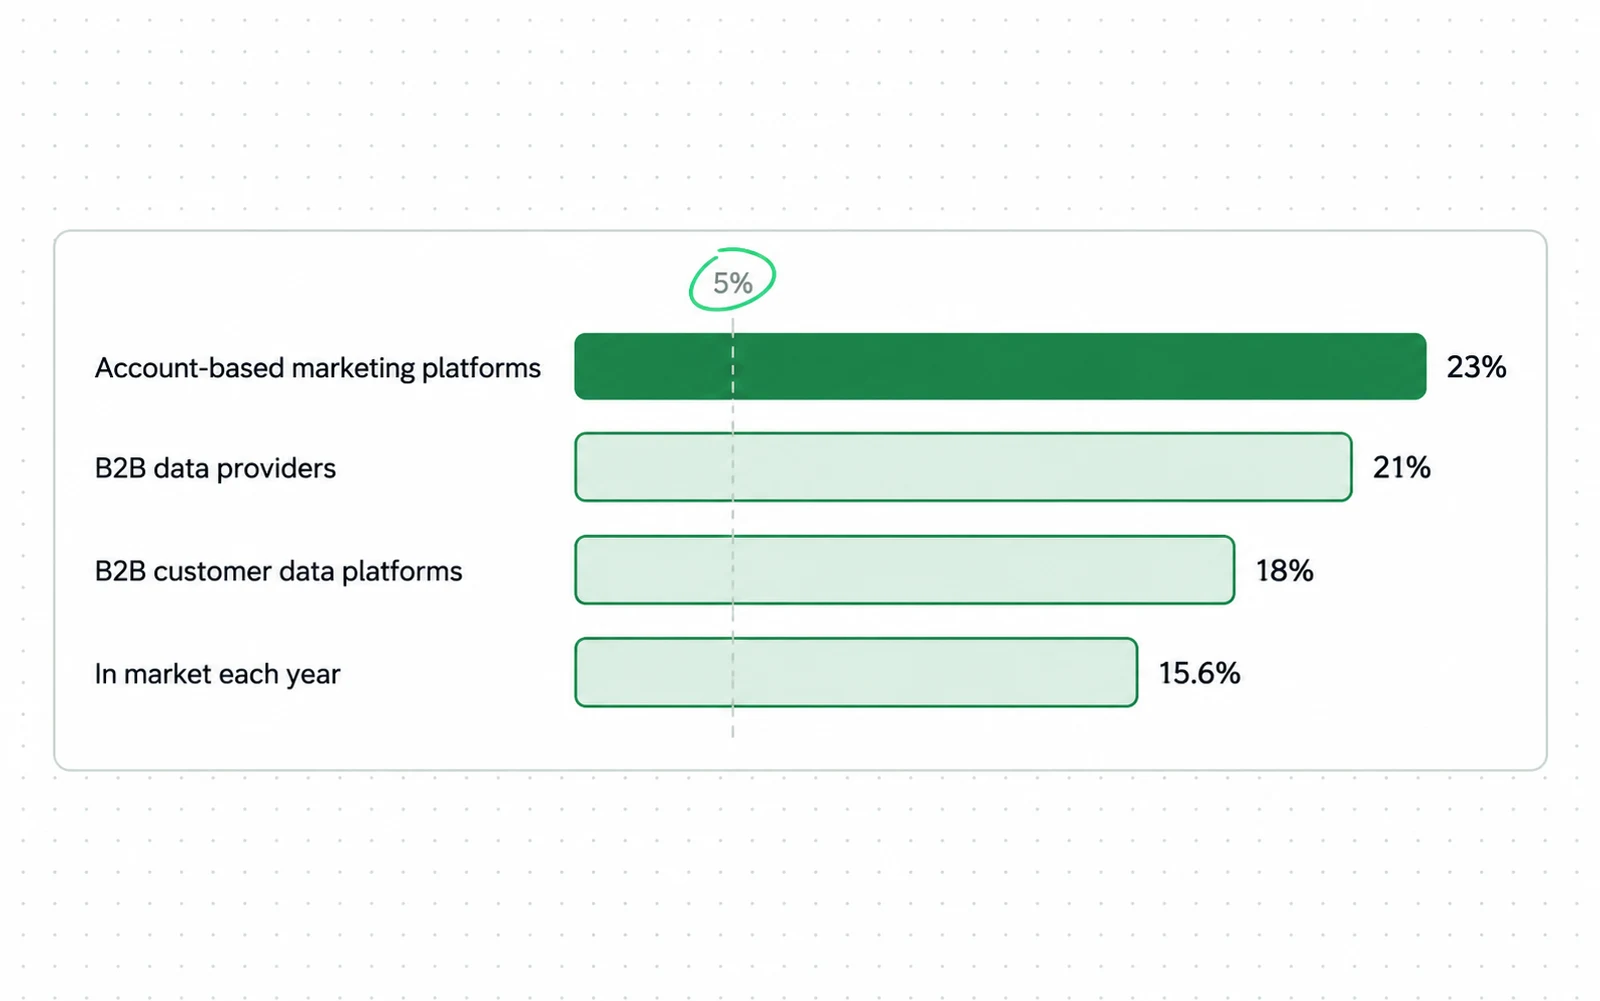
- Twenty percent of organisations plan to change provider, and 78 percent of those inside twelve months. That is where 15.6 percent a year comes from.
- The category spread is the useful part: 23 percent for ABM platforms, 21 for B2B data providers, 18 for customer data platforms.
- The closing advice is a range, not a constant, 15 to 30 percent, and only for marketing technology.
Read the two windows together and the disagreement gets smaller. The 95:5 rule implies about 20 percent in a year, while a separate measurement put B2B martech at 15.6 percent.
Comparing an annual number with the quarterly 5 percent makes it read as a correction. That is why it reads as a correction. On the same window the two sit close, and his category figures are the better input because they belong to a named market.
Neither figure is your number. Your category has its own replacement cycle. Ask your last twenty customers how long they had their previous supplier, and the median gives you the share.
For example, say that median comes back at three years. A third of your category is in the market this year, not a fifth. Your quarter holds about eight accounts in every hundred, not five.
What your replacement cycle implies
The five-year row is the one behind the 95:5 rule. Find your own row before you use anybody else's number.
Check whether account-based marketing fits your business
Four inputs, and you can get all four from records you already have. We built the arithmetic below, and every input in it is something you can look up instead of estimating.
Run it before you buy anything. Six steps, in order.
-
Count the realistic buyers
How many companies could plausibly sign, ever. Not the total addressable market from a slide. The list you could write out by name.
-
Find your replacement cycle
Ask your last twenty customers how long they had their previous supplier. The median is your cycle. Divide one by it to get the share in market per year.
-
Multiply
Realistic buyers times annual in-market share gives the accounts in play this year. Quarter it for this quarter.
-
Divide your budget by that number
That is what you can spend on each account in play. If the figure will not cover a piece of research and the B2B content marketing that goes with it, your tier one list is too long.
-
Check the deal against the cost
One-to-one work is a person's time. If a won deal is worth less than a few weeks of that time, run the programmatic tier and skip tier one entirely.
-
Name the accounts you cannot afford to lose
If three accounts would be more than a third of revenue, you are buying a risk as well as a strategy. The next section prices it.

The last row is where most plans break. Twenty tier-one accounts sounds modest until you divide the budget by it and see what is left for the 220 companies that are also real.
Suppose you take the paid side of a named-account programme in house. The ads skill has a playbook for it: LinkedIn and Meta list mechanics and the acceleration campaigns you would run.
Which twenty is a lead scoring question, applied to companies instead of people.
A small realistic universe with long cycles and large deals is the case account-based marketing was built for. A large universe of small deals is the case where ordinary demand generation wins, and demand generation vs lead generation is the split to read next.
Account-based marketing cost: budget share and concentration risk
Two costs, and only one of them is a budget line. The first is what the programme takes as a share of marketing spend. The second is what happens to the business when your revenue sits in fewer hands.
Budget share
Start with the budget. Momentum ITSMA runs an annual benchmark of roughly 300 ABM leaders, and the share it reports moves with how far along the programme is.

Notice what the 66 percent implies. At full scale this stops being a tactic you add and becomes the thing your marketing is. That is a decision about the company, not about the quarter.
Say you spend $180,000 a year on marketing. At the early-stage share, $47,000 goes to named accounts. At full scale it is $119,000, and the rest of your B2B demand generation lives on what is left.
That is the budget line. The second cost is not one.
Concentration risk
Now the second cost. Concentrating revenue in a few accounts changes the business, and two peer-reviewed measurements say what it changes.
Two peer-reviewed measurements of the same structural fact, and what each one priced.
| Study | What it measured | Result |
|---|---|---|
| Patatoukas, The Accounting Review, 2011 | Accounting rates of return, and operating expense per dollar of sales | Returns higher, expense per dollar lower |
| Dhaliwal, Judd, Serfling and Shaikh, Journal of Accounting and Economics, 2016 | Cost of equity capital | Higher, most of all where a major customer is likely to be lost |
Take the two findings in order. Patatoukas compiled three decades of supply chain relationships and found that suppliers with concentrated customer bases earn higher accounting returns, with less operating expense per dollar of sales.
That is the efficiency case for account-based work, measured outside marketing. Serving twelve buyers well costs less per dollar than serving twelve hundred.
Dhaliwal and colleagues measured the other side. Suppliers with concentrated customer bases carry a higher cost of equity capital. The effect is strongest where the supplier is likely to lose a major customer, or would be hurt badly by losing one.
One detail in that paper is the condition you need. Suppliers concentrated on safer government customers had a lower cost of equity. So the penalty tracks how replaceable the customer is, not concentration by itself.
Say you name your own concentrated accounts and price the programme against them: that is our B2B PPC service.
Five account-based marketing mistakes to avoid
Each of these is cheap to avoid at the start and expensive to fix in month nine, and the first two are versions of the same mistake.
Five, and the first two are the same mistake.
The list is too long. A hundred tier-one accounts is a segment with a new label, and it produces generic work at high cost.
The measurement never changes. Sales and marketing agree on the account list and keep reporting MQLs, so nothing about the reporting tells you whether the account moved.
The whole budget goes to accounts in market now. Dawes's point cuts both ways. The 95 percent who are not buying this quarter still choose from what they already recognise, and lead nurturing is what keeps you in that set.
The evidence comes from one side of the table. Momentum ITSMA reports revenue growth across ABM programmes. That finding is useful, and it comes from a survey of the people running the programmes.
That is not a reason to discard the finding. Check it against your own closed-won records before you put it in a plan.
Each failure, and the bill it produces.
| Failure | What it costs | The check |
|---|---|---|
| A hundred accounts in tier one | Generic work at bespoke prices | Divide the budget by the tier one count |
| Reporting stays on leads | You cannot tell whether an account moved | Ask for account coverage, not lead volume |
| Everything aimed at buyers in market | You are unknown to the 95 percent when they arrive | Split the budget by in-market and out-of-market |
| Evidence from programme owners only | A benchmark that flatters the decision | Compare against your own closed-won records |
| The list is never revisited | A plan written for a company that changed | Re-read the list every quarter |
And the quiet one. The account list is never revisited. For example, a company on your tier one list that was acquired in March is still getting the plan you wrote for the company it used to be.
Account-based marketing metrics and measurement windows
Three measures, and the window matters as much as the number. Read a quarterly figure against an annual expectation and you will kill a programme that was working.
Measure these three
Measure account coverage first. Take the share of the buying group at each target account that has engaged with anything, because one contact is one person and an account is a group.
A marketing qualified lead is still a person, so it is the wrong unit here.
Then measure movement between stages at the account level, not the lead level. The stages come from the B2B marketing funnel, and one account moving from unaware to a first meeting is the unit.
Then measure win rate and deal size against your own pre-programme baseline. Not against a published benchmark, because the published ones come from surveys of programme owners.
What to look at, and the window each measure belongs in.
| Measure | Window | What a bad reading means |
|---|---|---|
| Account coverage | Monthly | Your materials reach one person, so the account has not started |
| Stage movement | Quarterly | Coverage without movement means the work reaches people who cannot buy |
| Win rate and deal size | Annual | Anything shorter has too few accounts in it to read |
That last row is where the arithmetic from the fit test comes back. Say your quarter holds twelve accounts in play.
With twelve accounts, the difference between three wins and two is too noisy to read. A quarterly review will still read them as 25 percent against 17 percent, a gap of eight points.
Print the denominator.
Report the account count beside the rate every time you show it. A win rate with the denominator printed next to it is a number someone can argue with. That is the point.
Sources
- Salesforce Account-Based Marketing: the first organic result, defines ABM and states that a company needs enough high-value accounts before adding that ABM works at any company size
- Demandbase What is Account-Based Marketing: few, if any, companies can afford true one-to-one ABM across more than a fraction of their accounts
- Optimizely Account-based marketing: names long sales cycles and large deal sizes as the fit, with no figure attached to either
- Atlassian How to Use Account Based Marketing to Win High-Value Accounts: fit described as a defined group of high-value target accounts and a longer sales cycle, and the best-sourced statistics here
- ZoomInfo Account-Based Marketing, the complete guide for 2026: allocates the top 10 to 25 accounts to one-to-one work, the next 50 to 100 to one-to-few, and the rest to programmatic
- HubSpot 8 steps to build your account-based marketing strategy: a full programme with no entry condition and no account count
- John Dawes, Ehrenberg-Bass Institute The 95:5 rule, 2021: about 20 percent of business buyers are in the market across a year and something like 5 percent in a quarter, derived from a replacement cycle of around five years
- Marketing Week, Mini MBA B2B brand building using the 95:5 rule: the five-year cycle gives about 20 percent in market in a year and something like 5 percent in a quarter
- Forrester John Arnold, The 95-5 Rule Is Not A Rule But It is Not A Myth Either, 12 May 2025: around 15.6 percent of B2B martech buyers in market each year, 23 percent for ABM platforms, 21 percent for B2B data providers, 18 percent for customer data platforms
- Journal of Business Research Sandesh S., Sethuraman S. and Paul J., Key account management in B2B marketing: a systematic literature review and research agenda, 2023: 104 papers published between 1990 and 2022
- The Accounting Review Panos N. Patatoukas, Customer-Base Concentration: Implications for Firm Performance and Capital Markets, 2011: concentration is positively associated with accounting rates of return, with reduced operating expenses per dollar of sales and better asset utilisation
- Journal of Accounting and Economics Dhaliwal, Judd, Serfling and Shaikh, Customer concentration risk and the cost of equity capital, 61(1):23-48, February 2016: concentration raises the cost of equity, most where a major customer is likely to be lost, and lowers it where customers are governments
- Momentum ITSMA Annual ABM benchmark study, around 300 ABM leaders: ABM takes 28 percent of the marketing budget on average, 26 percent at early stage programmes, 34 percent at well established ones and 66 percent at fully scaled ones
- Momentum ITSMA, carried by Atlassian 2023 finding that 74 percent of ABM programmes report revenue growth
- Gartner, carried by Atlassian 2022 findings of a 28 percent improvement in account engagement and a 25 percent improvement in MQL to SAL conversion
Questions people ask
What are account-based marketing examples?
A research brief written for one bank, followed by a landing page that names its regulator and its integration stack. A dinner for eight people from four target accounts. An advertising campaign whose audience is a list of 60 company domains and nobody else.
The common thread is that the deliverable would be wrong for any other company. If the same asset works for a hundred businesses, it is good demand generation and account-based work is a different job.
What is the 3-3-3 rule for marketing?
The 3-3-3 rule is a copy and video attention heuristic about how long you have to catch, hold and convince. It has nothing to do with account-based work. It circulates in social and ad writing advice.
It has no connection to how account lists, tiers or account coverage are built.
How to start account-based marketing?
Run the fit test first. Count the companies that could realistically sign, find your median replacement cycle from your last twenty customers, multiply, and divide your budget by the accounts in play.
If the per-account figure covers real research and materials, start with a deliberately small tier one; 10 to 25 accounts is one published example and not a universal limit and run everything else programmatically. If it does not, the budget buys better demand generation than it buys account-based marketing.
What are the top account-based marketing platforms?
Specialist ABM platforms and the major marketing suites all sell account-based modules.
Buy the software last. The fit test, the account list and a shared definition of a qualified account all happen without a platform. Buy one before them and it automates a list nobody agreed on.