
PAID ADS SKILL
Reading the ads dashboard


How to read a paid-media dashboard without fooling yourself: platform reporting quirks, seven attribution models, multi-platform reconciliation, the ROAS-versus-LTV trap, statistical noise, incrementality, and twelve interpretation failures.
No key, no account needed Claude CodeClaude.ai (zip upload)Anthropic API
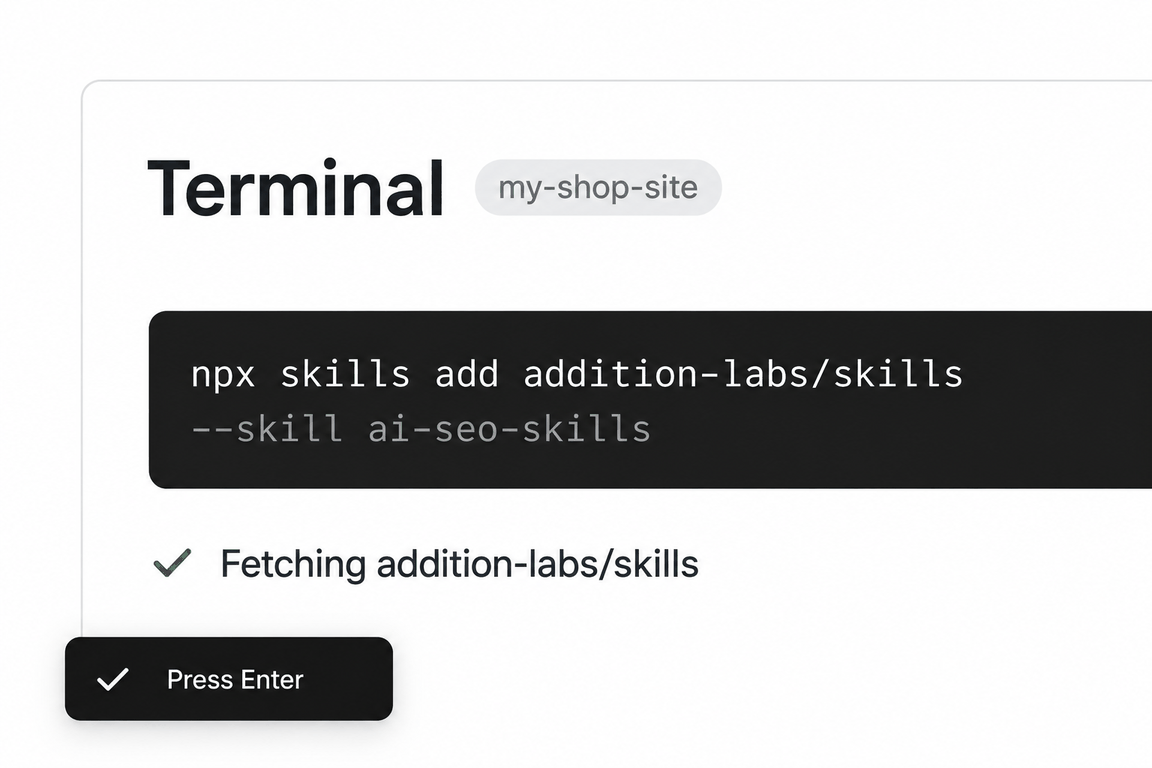
npx skills add addition-labs/skills --skill ads-performance-analyticsRun this in a terminal inside your project folder. Claude Code, Cursor and Codex then read the skill from where it lands.
- Step 01Open a terminal in your project folder
- Step 02Paste the command and press Enter
- Step 03Pick the agents to install to
- Step 04Ask the agent for the job; it reads the skill

ads-performance-analyticsaddition-labs/skillsMIT licencecommit a67dd34updated 2026-09-07
This is the skill to load the day before a scale, kill or rebudget decision. It assumes the strategy was sound and the creative was tested, and it asks only one thing: what does this number mean, and what must it be reconciled against.
Its examples are concrete without being invented for you: the campaign that reported 3.5x ROAS for six months and measured 1.2x in a geo holdout; the Google-Meta-LinkedIn stack that reported 1,600 conversions against 950 in the warehouse; branded search at 5 to 20% incremental, retargeting at 20 to 40%, prospecting at 50 to 90%.
Like every RampStack skill it carries the data-availability rule: when a required number is missing, the deliverable states the gap; it never estimates one to finish.
When to use it
The phrases that trigger it
Say any of these and an agent that has the skill installed will usually load it; you can also call it by name. The phrases are the skill’s own, from its description.
- read paid media dashboard
- attribution analysis
- ROAS vs LTV
- multi-platform reconciliation
- ad incrementality
- geo holdout
- conversion lift study
- blended CAC
- MMM
- MTA
What’s inside
The playbook, section by section
The nine-item result panel
Spend, impressions, clicks; conversions with definition and window visible; attribution breakdown; frequency; saturation; time series; cost metrics in a named currency; conversion paths; filters and exports. Missing rows are where to dig.
Platform-reported versus reality
Meta 7-day click plus 1-day view against Google 30-day click plus 1-day view; view-through often half of reported conversions; modelled iOS conversions as educated guesses; every platform claims the same sale.
Multi-platform reconciliation
Trust the order system for totals, platforms for ranking within platform, never platform sums; blended CAC is total spend over total new customers from the order system.
ROAS versus LTV
Meta 2.5x ROAS at $80 LTV against Google 1.8x at $200 LTV: the lower ROAS is the better channel over the customer lifetime.
Noise
Real changes are 30% or more in metrics that vary 10 to 20% naturally; day-of-week, seasonality, exogenous events and reporting delay all masquerade as signal.
Incrementality
Geo holdout, Google Conversion Lift and Experiments (the skill notes "ghost bidding" is a literature term, not a Google feature), Meta conversion lift, PSA tests; run quarterly on the biggest lines.
Reference files the agent loads on demand
7 files in the skill folder, read only when an instruction calls for one.
metric-definitions-glossary.md- Every dashboard metric with its formula and the pitfalls in how teams use it.
attribution-model-comparison.md- Each attribution model: definition, fit, bias direction, and one worked example scored across all of them.
platform-reporting-quirks.md- How Google Ads, Meta, LinkedIn, TikTok and programmatic each count and credit conversions, and why their totals disagree.
incrementality-testing-playbook.md- Five incrementality methods (geo holdout, Google and Meta lift studies, PSA tests, switchbacks), how to choose, and a geo holdout step by step.
dashboard-reconciliation-patterns.md- The warehouse as the single source of truth, platforms as in-flight signals, and how to reconcile them.
cohort-analysis-templates.md- Three cohort cuts for paid media: by acquisition month, by channel, by campaign, with retention curves.
common-interpretation-failures.md- Twelve recurring misreadings of paid media reports, each with symptom, cause, fix and prevention.
See it in action
One real run, in full
The request on the left went to the skill as installed. On the right is everything it returned, unedited; scroll inside the box to read it all.
A client's Meta retargeting campaign shows 3.5x ROAS in Ads Manager over the last 30 days and they want to triple its budget next month. Walk us through your 12 considerations for this specific decision and tell us what we must check before agreeing. We have Shopify order data but no warehouse.
Should we triple the Meta retargeting budget? The 12 considerations, applied
Decision on the table: a Meta retargeting campaign reports 3.5x ROAS in Ads Manager over the last 30 days; the client wants to 3x its budget next month.
What we have: Ads Manager numbers, Shopify order data. What we do not have: a warehouse, a unified attribution layer, GA4 confirmation, or any incrementality test result.
Framework answer right now: HOLD. Not because 3.5x is wrong, but because the one number we have is the one number the framework says never to act on alone. Retargeting is the campaign type most likely to look excellent in-platform and least likely to be incremental. Below is each consideration applied to this campaign, then the checklist we need cleared before saying yes.
A note on the data gap up front: everything below that needs a customer count, a revenue figure, or a lift number is stated as a check to run, not a result. No figure in this document is estimated. Where the skill's reference material gives a typical range, it is labeled as a typical range, not as this client's number.
The 12 considerations
1. Result panel completeness. What is Ads Manager showing us, and what is it hiding?
For this decision the panel must expose, for this campaign and this 30-day window: spend, purchases, purchase conversion value, the attribution setting applied, the breakdown by attribution type (click vs view vs modeled), frequency, and a daily time series. If the 3.5x came from a top-line campaign row with the attribution breakdown collapsed, we have not yet seen the number; we have seen a summary of it.
Meta specifically hides the modeled-conversion share unless you open the attribution breakdown. That is where we dig first.
2. Platform-reported vs reality. What does "3.5x" actually count?
Meta's default attribution is 7-day click plus 1-day view. On a retargeting audience, view-through is the trap: the audience is, by definition, people who already visited the store. Many of them see the ad in feed, do not click, come back through a bookmark or a Google search, and buy. Meta credits that purchase to the ad under 1-day view.
Three things to pull from the breakdown view for this campaign:
- Purchases and value on 7-day click only and on 1-day click only.
- Purchases and value credited to 1-day view.
- The modeled share (iOS opt-outs are estimated, not observed).
The 3.5x is unreadable until we know how much of it is click, how much is view, and how much is modeled. Whether CAPI is installed matters here too: without it, the iOS portion is thinner and more modeled.
3. Attribution model. Pick one and read the others as sanity checks.
We do not have a warehouse MTA, so the practical primary model is last-click on the Shopify side, using whatever the store captures (UTM parameters, landing-page referrer, Shopify's own order attribution where enabled). Read Meta's 7-day-click view as the generous end and Shopify last-click as the conservative end. If the two are far apart on this campaign, the gap is the amount we do not yet understand, and that gap is the thing we would be tripling.
Do not switch attribution settings inside Ads Manager mid-evaluation; compare the same window under the same setting before and after.
4. Multi-platform reconciliation. Sum-of-platforms is always inflated.
Even if Meta is the only paid platform, the reconciliation still applies against organic, email, direct, and branded search. A retargeting audience overlaps heavily with the email list and with branded searchers. Every one of those channels can be claiming the same order.
The check: for the same 30 days, total Shopify orders and revenue versus the sum of every channel's claimed conversions (Meta purchases, Google Ads if any, email platform attributed orders). If the claimed sum is well above Shopify's actual total, Meta's share of the double-count is unknown until tested, and a 3x budget scales the double-count with it.
5. ROAS vs LTV horizon. Short-term metric, long-term impact.
Retargeting mostly re-sells to people who already know the brand. Two questions Shopify can answer:
- Of the orders Meta is claiming, what share are returning customers versus first orders? Shopify flags this per order.
- What is the AOV and the product mix of those orders compared with the store average?
If the campaign is mostly re-converting existing customers, "3.5x ROAS" is measuring revenue that likely carries lower incremental value than new-customer revenue, and the client's LTV math should be built on new-customer cohorts, not on this campaign's ROAS.
6. Cohort vs daily. Quality story versus volume story.
Daily ROAS tells us the last 30 days looked good. It cannot tell us whether the customers this campaign brings in (if any are new) behave differently from other cohorts. With Shopify order history we can cut: customers whose first order falls in the retargeting window and carries a Meta UTM, by first-order month, and watch repeat rate at 30, 60, 90 days against the store's baseline cohorts. This will not be answerable next month for a decision that happens next month; that is a reason to scale in steps rather than 3x at once.
7. Statistical noise. Weekly variance, day-of-week, seasonality, exogenous events.
Thirty days is one data point at the monthly grain. Pull the daily series for this campaign and ask:
- Is the 3.5x driven by a few high-value days (a sale, a launch, a large order) or is it steady across the window?
- Was there a promotion, an email send, an influencer post, or a seasonal lift in that window? Retargeting is downstream of all of them and will absorb their credit.
- Was the campaign changed (budget, audience, creative) inside the window? Learning-phase resets distort the series.
A retargeting campaign that hit 3.5x during a promo week will not hold 3.5x in a quiet month at three times the budget.
8. Incrementality. What would have happened without the spend?
This is the core of the decision. The skill's reference material puts retargeting's typical incremental rate at 20 to 40 percent; that is a category range, not a measurement of this account. This campaign's own rate is unknown until it is tested.
The decision-relevant arithmetic, to be run only once a lift result exists: platform ROAS multiplied by the measured incremental rate gives the incremental ROAS. That is the number the budget decision should be made on. We do not have that number today. Until we do, the honest label for 3.5x is "platform-attributed, incrementality untested."
9. Geo and holdout testing. The honest causal test.
Two workable paths for this account:
- Meta Conversion Lift on this campaign. Configured in Ads Manager, three to four weeks, Meta requires a minimum spend, reports lift with significance bands. Cross-check the result against Shopify orders in the same period. Meta's interpretation leans generous, so read the lower bound.
- Geo holdout: exclude a set of matched regions from the retargeting campaign for two to four weeks, pre-commit the window, compare Shopify orders per capita in held-out versus exposed regions. Shopify has the shipping region on every order, so this test does not need a warehouse.
The cheapest version of "let's triple it": run the lift test during the first month at current spend, decide on the result. The test costs weeks, not the quarter of tripled un-incremental spend it prevents.
10. Self-attribution bias. Platforms claim credit they do not deserve.
The retargeting audience is the population most likely to convert anyway. Meta's pixel fires on the purchase; Meta claims it. There is no dishonesty in the mechanism, only an incentive. The detection rule from the skill: platform-reported conversions exceeding the store's attributed conversions for the same channel by more than about 30 percent signals heavy double-counting. Run that comparison for this campaign specifically (Meta purchases vs Shopify orders carrying this campaign's UTM or attribution).
11. Decision rule. Pre-commit scale up, hold, or pull back.
Before any budget moves, write down the rule and the numbers it depends on. A shape that fits this case, with the thresholds to be set by the client and us rather than by this document:
- Scale if the lift test shows an incremental ROAS above the client's breakeven on contribution margin, and the daily series is steady rather than promo-driven, and frequency is not already high.
- Hold if the test is inconclusive, the click-only ROAS is materially below 3.5x, or the window contained a promotion.
- Pull back if the lift result shows the campaign is mostly harvesting orders that Shopify shows would have arrived anyway.
If scaling: step the budget rather than jumping 3x. Meta's own learning behaviour and audience saturation both argue against a single large jump; a retargeting pool has a fixed size, and tripling spend against the same pool mostly raises frequency and CPM rather than orders. Watch frequency and marginal CPA at each step and pre-commit the stop condition.
12. Single source of truth. Store data over platform reporting.
No warehouse does not mean no source of truth. For this client, Shopify orders are the canonical record of what was actually sold, to whom, when, for how much, new versus returning, and shipped where. Ads Manager is the in-flight signal. Every number that goes to the client as a recommendation should be labeled with its source: "Meta-reported, 7-day click + 1-day view" or "Shopify orders, last-click UTM" or "measured lift, Meta Conversion Lift, lower bound."
What we must check before agreeing
In order. Items 1 through 6 are pulls we can do now from Ads Manager and Shopify. Item 7 is the test that actually answers the question.
- Attribution breakdown of the 3.5x. Purchases and value under 7-day click, 1-day click, 1-day view, and modeled, for this campaign, this window. Record each. If view-through and modeled together are a large share, the click-only ROAS is the number to carry forward.
- Daily series and window hygiene. Daily spend and revenue for the 30 days; any promotion, email send, launch, or campaign edit inside the window; whether the campaign was in learning at any point.
- Shopify reconciliation for the same 30 days. Total orders and revenue; orders carrying this campaign's UTM or Meta attribution; the ratio of Meta-claimed purchases to Shopify-attributed orders for this campaign. Also the sum of all channels' claimed orders versus Shopify's actual total.
- New vs returning split of the claimed orders. From Shopify's per-order customer flag. Plus AOV and product mix versus store average, so a margin view can replace a revenue view.
- Audience size and frequency. Retargeting pool size (Meta audience estimate), current frequency, and how frequency moved across the window. This tells us whether 3x budget can even be spent against this audience without saturating it.
- Tracking setup. Is CAPI installed and deduplicating against the pixel? Is UTM tagging on the ads consistent enough for Shopify to attribute? A gap here explains a lot of the Meta-vs-Shopify divergence and should be fixed before any test is read.
- An incrementality test before the budget moves. Meta Conversion Lift on this campaign, or a Shopify-region geo holdout, two to four weeks, window pre-committed, result read against Shopify orders. The budget decision is made on incremental ROAS, not on platform ROAS.
- A written decision rule. The breakeven incremental ROAS on contribution margin, the step size if scaling, the frequency and marginal-CPA stop conditions, and who signs off. Written before the first budget change, not after.
Recommendation to bring to the client
Not "no." "Not yet, and here is the four-week path to yes." Keep the campaign at current spend, run the lift test now, pull the reconciliation and breakdown this week, and step the budget on the measured result rather than the platform number. If the test confirms the campaign is strongly incremental, the client scales with confidence and a number they can defend. If it does not, the client has avoided tripling spend on orders they were already getting.
Stated gaps (per the skill's data-availability rule): no attribution breakdown, daily series, frequency, audience size, Shopify reconciliation, new-vs-returning split, tracking status, or lift result has been seen. Every check above is a check to run, and no result has been assumed. The final Scale / Hold / Kill call cannot be issued until items 1 through 7 return.
What this run could not do
It had no account data (attribution breakdown, daily series, frequency, audience size, CAPI status), no Shopify reconciliation figures and no incrementality result, so those parts are written as checks to run, with the gap stated and no number estimated. The 20 to 40 percent retargeting range is quoted from the skill's reference as a category range.
Method behind it
Where we would differ, and why
Our Performance Max guide is the case study of this skill’s PMax warning: a black box that reports the branded search you would have had for free. Read the skill for the twelve considerations, the guide for what PMax hides and how to audit the brand queries inside it.
The skill treats a warehouse as the canonical source. A Shopify store has no warehouse; Shopify orders are the canonical count, and the skill’s reconciliation pattern works unchanged with that substitution.
It recommends MMM as the mature-stage reference. Below a few hundred thousand a year in spend the regression has nothing to fit; incrementality tests are the ceiling.
SKILL.md
The file the agent reads
Written by RampStack and published under the MIT licence. Read the full file (3,478 words) on GitHub, at the commit we reviewed: rampstackco/claude-skills/skills/ads-performance-analytics/SKILL.md. The reference files are in the same folder.
Questions
Questions people ask before installing
Our client wants to triple a 3.5x ROAS campaign. What does the skill say?
Check the window and the view-through share, reconcile against orders, look at the audience composition (retargeting hot leads reads high), check cohort LTV by channel, and run a geo holdout before scaling. Its worked example is that exact campaign, and it measured 1.2x.
Does it connect to Meta or Google?
No. Pair it with a connector: the Google Ads MCP or claude-ads on our toolkit shelf for reads, or a pasted export.
What if I cannot run a holdout?
The skill’s rule: state the gap. The decision then defaults to hold, not scale.