

Verdict: run both and set the ratio by click share
Run both. Set the ratio from the measured click share in your category, not from a preference. In some ecommerce categories paid results now take a third of the clicks. In others organic still takes more than four fifths. No study sets an optimal ratio, and none of them knows your margins, so treat the click share as the input and the split as your decision.
The starting point is a measurement, the split is a judgement.
That is a smaller claim than most comparisons make, and it is the one the data supports. Both channels buy attention. One bills per click and the other bills in time and salary, and neither is free in the sense the word usually implies.
SEO vs PPC compared criterion by criterion
Those two bills are what the comparison has to weigh, and the usual version of this table weighs four contrasts instead. Semrush’s is a clear example of it. Six criteria change the answer for a store, and this is where each one lands. Nothing here is a scorecard: two rows favour paid, two favour organic, and two depend entirely on your numbers.
| Criterion | Organic search | Paid search |
|---|---|---|
| What you pay | Time and salary, before any traffic arrives | Per click, priced in an auction |
| When it starts | After the work is indexed and ranks | As soon as the campaign is approved |
| What happens when you stop | The pages stay up and keep whatever they hold | Paid traffic stops when the budget does |
| Where the risk sits | The spend happens before you know whether it ranks | The spend can be stopped once you see the cost per order |
| Click share in your category | Falling in the categories measured below | Rising in the categories measured below |
| Who it suits at the start | Margins that cannot cover a click price you can look up | Margins that survive the auction price |
Arguments for organic search
Google states the case for organic plainly, and the sentence repays reading word for word: “There’s no cost to appear in organic search results like Google’s.”
What the word free is pricing
Appearing is free. Ranking is not.
Improvements to SEO can help your website rank higher on Google Search by making it more relevant to users. PPC ads like Google Ads are paid online advertisements which allow businesses and website owners, like you, to bid on the chance to show an ad next to searches on Google.com. Understanding the interplay between PPC and SEO can help you formulate a more comprehensive marketing strategy.
business.google.com read 5 September 2026
- The publisher is Google Ads, and the article compares Google Ads to the free alternative. Read the framing knowing that.
- The takeaway paragraph does not pick a winner. It describes an interplay between the two and stops there, which is a narrower claim than most articles on this question make.
- The date matters more here than usual. March 2023 is before AI Overviews appeared on these results, so nothing on the page accounts for what sits above both of them now.
Two bills for the same visitor, worked at a $0.90 click
Receipt
Paid search, one month
- 2,400 clicks$2,160
- Management$800
- Creative and landing pages$400
Monthly total$3,360
Receipt
Organic, one month
- Clicks$0
- Content and technical worksalary or retainer
- Time before it earnsmonths, not days
Monthly totalunbilled, not unpaid
| What is being priced | Organic | Paid |
|---|---|---|
| A position on the page | Nothing | Nothing |
| Being eligible for that position | The work that gets you there | A campaign and a bid |
| Each visitor who arrives | Nothing | The auction price of the click |
| The attempt that does not work | Already committed | Stopped when you stop bidding |
The sentence is accurate and it prices one thing only. There is no charge for a position, and there is a real cost to earning one. A rough sense of how often that cost buys nothing: Ahrefs analysed roughly 14 billion pages in its index in 2023 and found 96.55 percent get no traffic from Google. That index contains everything Google has crawled, not only pages written to rank. Read it as the scale of the web that earns nothing, not as a failure rate for SEO work. Some of the cost is not editorial at all. Loading performance is graded on its own scale, and the three Core Web Vitals are the part of organic work with a published pass mark.
| Question about the money | Organic | Paid |
|---|---|---|
| Charged per click | No | Yes |
| Charged before any traffic arrives | Yes | No |
| Stops costing when you stop | No, the work is already paid for | Yes, the same day |
| What you have if it does not work | The pages, and whatever they earn later | The clicks you already bought |
Priced as a service, the closest published figure is Ahrefs’ survey of 439 SEO providers: $2,917 a month on average and $111 an hour. It prices general work, not a store’s catalogue, and what a catalogue needs is set out in ecommerce SEO. Finding where a store leaks is a separate diagnostic pass, an ecommerce SEO audit. On one platform much of it is already decided for you: what Shopify decides for you.
The work itself is less editorial than the word content suggests. Most of the topics in Google’s own ecommerce documentation are structure and data. The technical starting position differs by platform, not by effort: the Web Almanac puts good mobile Core Web Vitals at 76 percent of Shopify stores against 35 percent of WooCommerce ones. There is also no instruction set. Even a canonical tag is only a strong signal, in Google’s own wording, and not a directive. That is the structural difference from buying a placement: one is influenced and the other is purchased.
Arguments for paid search
Paid search is the purchased side, and it bills per click at a price set in an auction, not by a rate card. Most comparisons skip that part. What has changed is not the mechanism. What changed is how many of the clicks now go through it.
The ground moved, and it was measured.
Aleyda Solis compared Similarweb click distribution for the top 5,000 US queries in headphones, jeans and online games and the top 956 in greeting cards, January 2025 against January 2026. Classic organic click share fell in all four. Text ads rose in all four.

| Category | Classic organic, Jan 2025 | Classic organic, Jan 2026 | Change |
|---|---|---|---|
| Headphones | 73% | 50% | minus 23 points |
| Jeans | 73% | 56% | minus 17 points |
| Greeting cards and ecards | 88% | 75% | minus 13 points |
| Online games | 95% | 84% | minus 11 points |
Search Engine Land reported the same analysis four days later and added the advertiser side of it: Amazon’s paid clicks up 35 percent, Walmart’s up sixfold, Gap’s up 137 percent. Its write-up carries no methodological caveat, which matters when a single vendor’s panel data is the basis for all of it.
What you pay per click is not a list price. Google Ads names six inputs that decide position and price, and only one of them is your bid. How that plays out is how the Google Ads auction works, and it is the part that determines whether that 36 percent is affordable for you specifically.
When does the SEO vs PPC verdict not hold?
Our reading is that category click share belongs in the decision and margin decides it. Click share says where the buyers in a category are, not what a click is worth to you, and nobody has published the bridge between the two. Three situations make following the share alone expensive, and the first is in the same dataset.
The data does not say the same thing everywhere.
In online games, classic organic still takes 84 percent of clicks. The category moved sharply in relative terms, with text ads going from 3 to 13 percent. It still ends the year with organic holding more than four fifths of the clicks. A store there that shifted budget on the headline number would be moving away from where the clicks are, which is the same error in the other direction.
Two cases outside the click data
The second case is margin. An auction price is indifferent to what you sell it for. The comparison people reach for is the click price against the profit on an order, and it is the wrong one: most clicks do not become orders. What has to clear the profit is the cost per order, which is the click price divided by the share of clicks that convert. A $1 click at a 1 percent conversion rate is a $100 order cost. What that order is worth, and whether the site converts the visit at all, is the question conversion rate optimization answers. None of the click-share data changes that arithmetic.
Three ways to misread the verdict, and the first is in the same dataset it rests on:
- Your category has barely moved. Check your own top queries, not the headline number.
- The click costs more than the order earns. Check cost per order, which is click price divided by conversion rate, against contribution per order.
- You read four categories as the whole market. Check whether anyone has measured yours.
The third is scope. All four categories are US queries in one vendor’s panel, compared across two single months. A January against a January removes one seasonal mismatch. It leaves promotions, holiday timing, query mix and everything else in. The study also reports one provider’s measurement of behaviour, not Google’s own. It also measures clicks on Google and not what assistants do with the same question, which is a third surface entirely and the subject of AI search engine optimization. That study is the only category-level measurement anyone has published, and it is not a census.
Below is what that count looks like on a product query. Read the order: a row of paid product cards, then the text ads, then the first blue link.
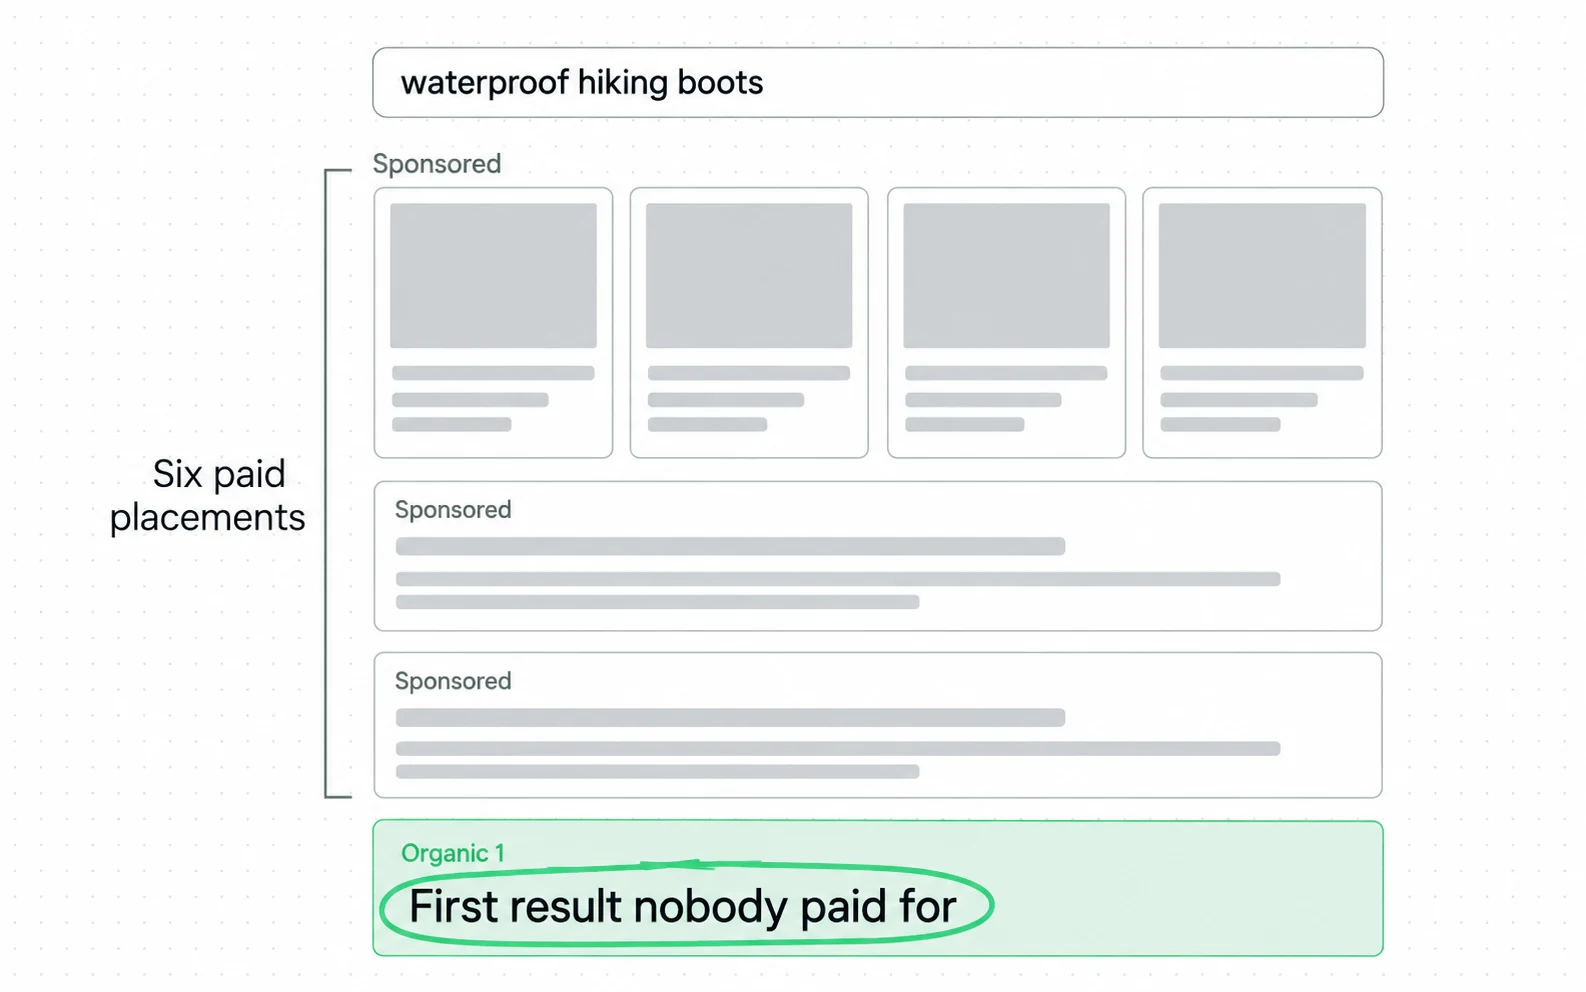
Do the count on your own best-selling term before you move any budget. It answers a smaller question than the study does. How much of the first screen in your category is bought today, on one page at one moment, against behaviour across thousands of queries. Nobody has published the bridge between that count and click share. Use it as a reason to look at your own numbers next, not as a reading you can allocate against.
Suppose the count sends you to the organic side: that is ecommerce SEO services at Addition, a search marketing agency.
Sources
- Aleyda Solis Text ads take a bigger share of Google clicks, Similarweb data, Jan 2025 against Jan 2026
- Search Engine Land Paid search click share doubles as organic clicks fall, with advertiser-side figures
- Google for Business SEO vs. PPC: Understanding the Difference. There is no cost to appear in organic search results This page carries no publication date of its own.
- Ahrefs Search traffic study: 96.55% of roughly 14 billion indexed pages get zero traffic from Google
- Ahrefs SEO pricing survey of 439 SEO providers: $2,917 a month average, $111 an hour This page carries no publication date of its own.
- Google Ads Help About Ad Rank: the six inputs that decide position and price
- Google Search Central Ecommerce best practices: eight topics, six of them about structure and data
- HTTP Archive Web Almanac 2025 Ecommerce chapter: platform share and Core Web Vitals by storefront platform Dated 2025 with no month given, so its exact age is not knowable from the source.
- Semrush SEO vs. PPC: Differences, Pros, Cons, and How to Choose This page carries no publication date of its own.
- Google Search Central Consolidate duplicate URLs: rel=canonical is a strong signal, not a directive
Questions people ask
Is Google Ads considered PPC?
Yes. PPC is the billing model, pay per click, and Google Ads is one platform that uses it. The price of each click is set in an auction, not published as a rate.
Are Google Ads considered SEO?
No, and the distinction matters for measurement. Ads are bought placements marked as sponsored; organic positions are earned and unmarked. They appear on the same page and are reported separately, which is why a combined traffic number hides which one moved.
How to use PPC and SEO together?
Let the measured click share in your category inform the ratio, not a rule of thumb. In headphones queries paid results took 36 percent of clicks in January 2026 against 16 percent a year earlier; in online games organic still took 84 percent.
In practice: look at your own top queries, see how much of the page above your position is sponsored, and set cost per order against the contribution each order leaves. That is the same comparison the table names.
Is SEO dead now with AI?
The measured categories say smaller, not dead. Classic organic still took between 50 and 84 percent of clicks in January 2026, down between 11 and 23 points in a year. A channel losing share is a budgeting question, not an obituary.

