

Evidence behind alignment claims
Alignment is the coordination of goals, definitions and data between the two teams, and that definition is not in dispute anywhere. The arguments start one layer down, at the evidence for why any of it is worth the effort.
The definition is the strategic coordination of goals, processes and communication between the two departments. It names three things to keep in step: what the two teams are aiming at, how work passes between them, and what data both of them read.
One survey does put a size on the problem this creates. The Content Marketing Institute asked 980 B2B marketers between June and August 2024, and 40 percent named cross-team communication and silos as a challenge.
The year after, the Content Marketing Institute surveyed 1,015 marketers, and 33 percent named measuring content effectiveness. Both of those are handover problems before they are anything else, and both are things your two teams can settle in a meeting.
What travels with the definition is a set of benefit figures, always the same ones. Aligned teams are said to grow revenue twenty percent a year against a four percent decline, with thirty six percent more retention and thirty eight percent better win rates.
Those numbers appear on page after page, and following them back is more interesting than reading them.
The peer-reviewed literature is more careful. Wim Biemans, Avinash Malshe and Jeff Johnson reviewed more than 25 years of research on the sales-marketing interface in Industrial Marketing Management in April 2022.
Their stated task includes resolving definitional ambiguities in that literature. When a field still has ambiguities in the word after 25 years, the definitions your two teams write down matter more than the benefit percentages.
One widely repeated four-stage framework sorts teams as undefined, defined, aligned or integrated. It was published in July to August 2006; the date was checked, and the article body sits behind a paywall.
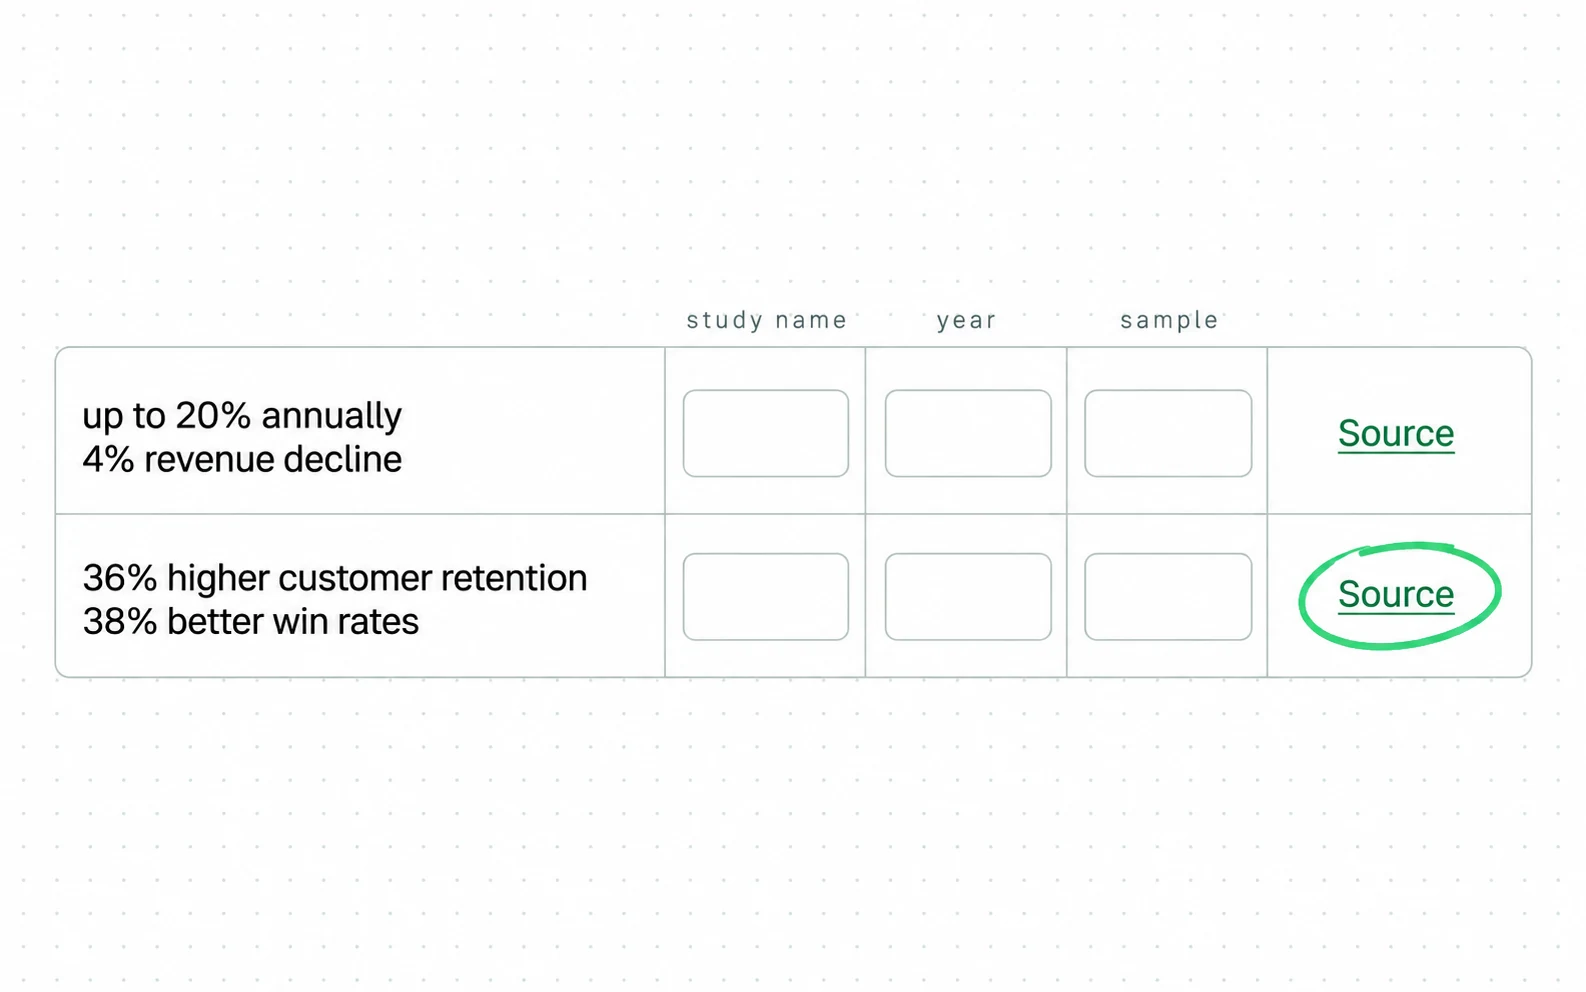
- Neither line carries a study name, a year or a sample. The attribution is a link labelled Source.
- Follow the second link and it reaches another publisher, which credits the figures to a third.
A figure with no citation behind it is not a small rounding problem when the number is large. It ends an internal debate, and nobody in the room can check it.
Following one statistic back to its source
Take the retention and win rate pair and walk it back. Every hop is a reasonable citation, and the chain still ends at a 2010 study that nobody quoting it links to.
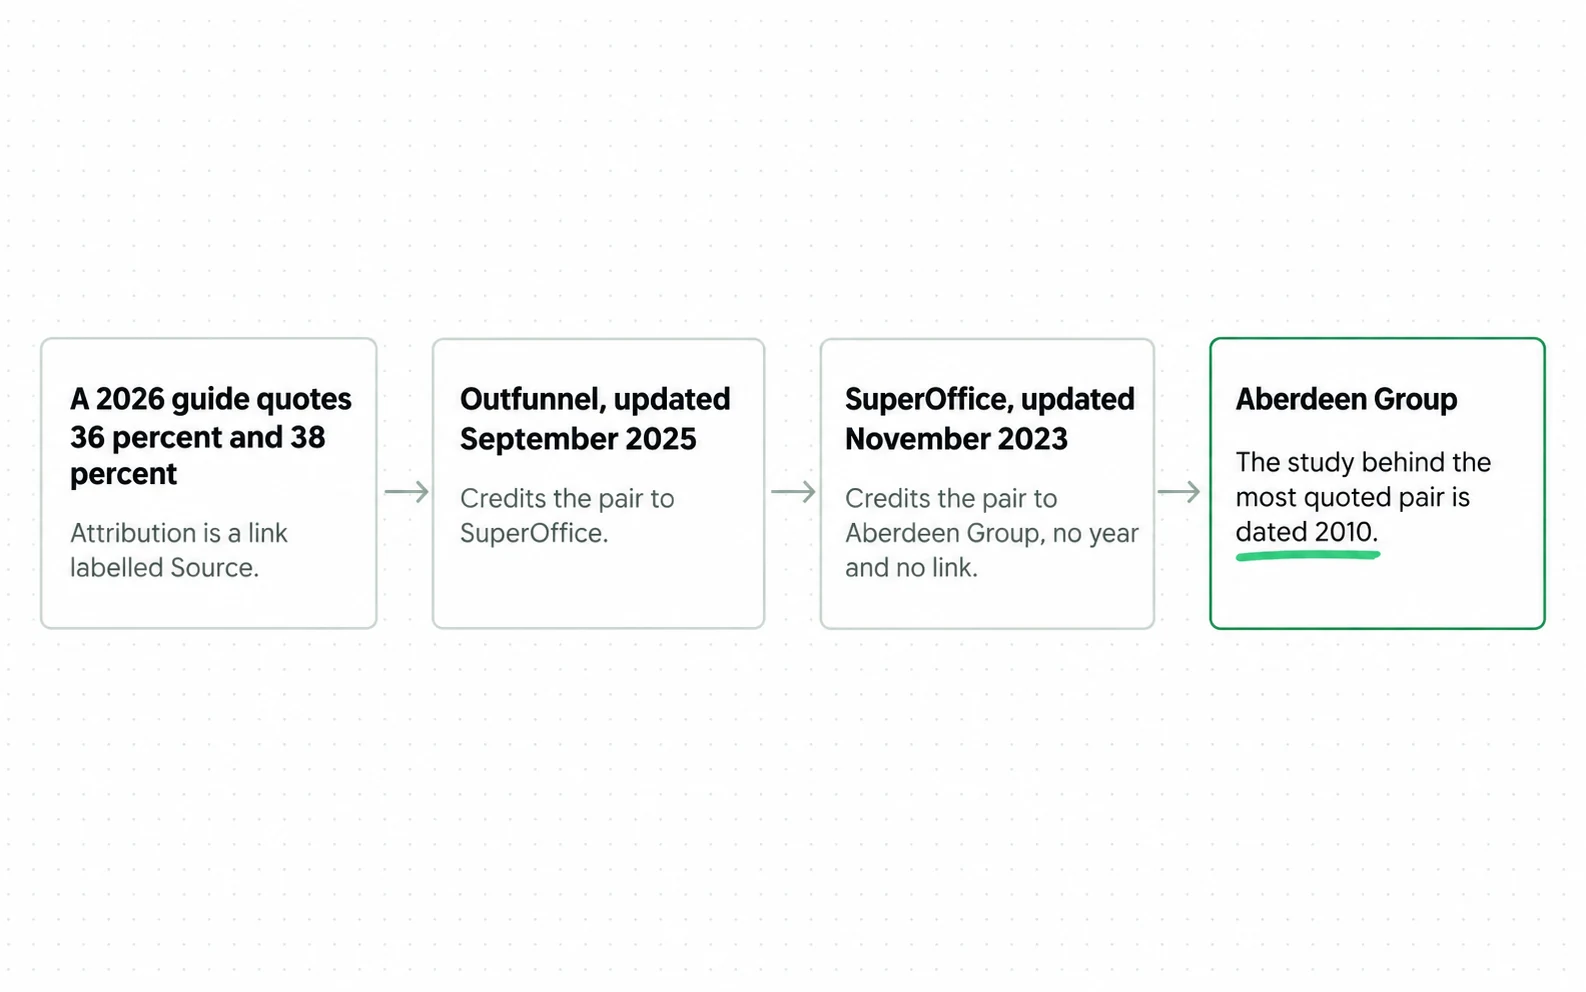
Most of the evidence lives at the third step above: seven figures credited onward to two research firms, with the year, the sample and the link stopping there.
How old the quoted evidence is in 2026
The top bar is the measurement. The two below it are the dates a reader sees on the page they are reading.
None of this means the effect is imaginary. It means the number defending a budget in 2026 was measured before the tools that budget pays for existed.
Two tests to run on any benefit figure
The first is the study year. An update date belongs to the page, not to the measurement, and when the study year is absent that absence is the finding.
The second is the evidence class. A customer case study is a single account, and set beside a survey percentage in the same list it borrows a weight it was never measured to carry.
Peer-reviewed work exists on this, and the benefit figures in circulation never cite it. Le Meunier-FitzHugh and Piercy published a study in 2007 finding a direct and positive relationship between collaboration and business performance.
The abstract does not publish a multiplier. It names five antecedents instead: senior management attitude, less interdepartmental conflict, better communication, organisational learning, market intelligence. The abstract is readable and the paper sits behind a paywall, so no sample is quoted here.
Three definitions to write down
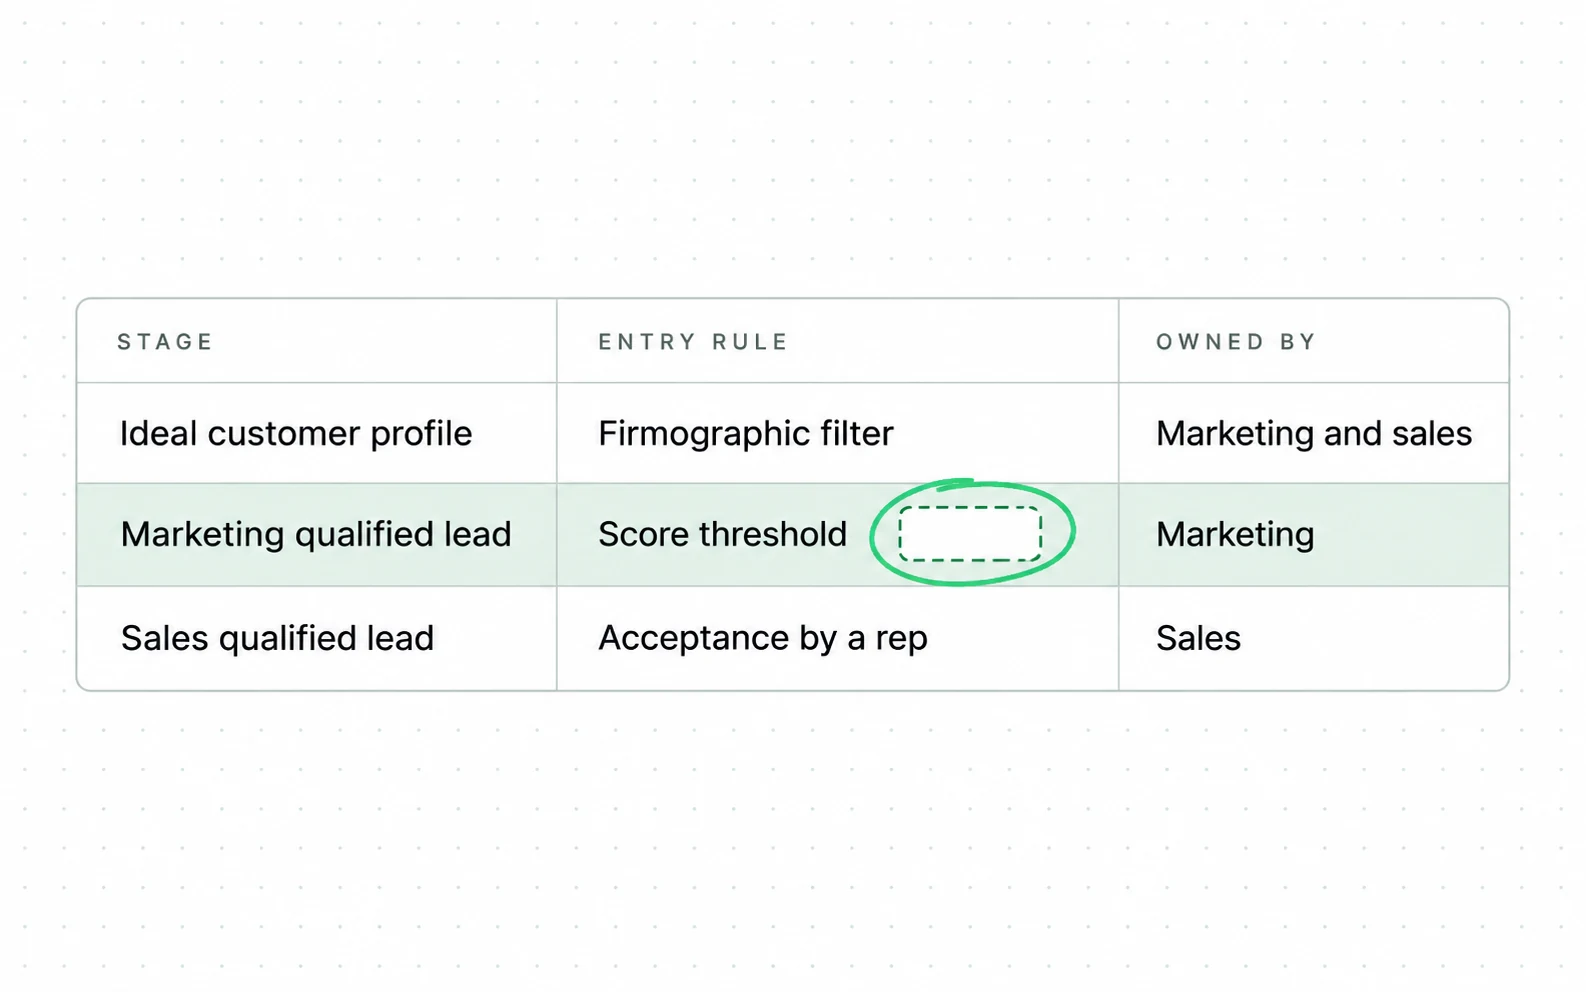
No multiplier comes out of a meeting, but three definitions do. Two teams have to agree on an ideal customer profile, a marketing qualified lead and a sales qualified lead. The names are the easy part, and the numbers behind them are the decision.
-
Write the profile as filters
Three conditions a stranger could apply to a company list. The test and the failure modes are in ideal customer profile.
-
Set the marketing threshold as a number
A score, a behaviour or a firmographic gate, written down. What the threshold is for is in marketing qualified lead.
-
Name what sales acceptance means
Acceptance is a separate step from creation, and sales qualified lead sets out what the rep is checking.
-
Write the return path
What happens to a lead sales declines. This is the row most accounts leave empty, and it is where the two teams stop agreeing without noticing.
-
Date the agreement
Put the date beside it. A definition with no date cannot be shown to have drifted, and drift is what the arguments are usually about.
One more thing belongs in the same document, and it is the cheapest of the five. Write who can change each definition, because a rule two teams share and either can edit alone is not shared.
None of this needs a workshop. It needs an afternoon, a document, and a date on the front of it.
Where those thresholds sit relative to each other is the subject of MQL vs SQL, and it is the same argument this term is usually standing in for.
Survey evidence on sales and marketing alignment barriers
The causes are better measured than the benefits, and they are the more useful half, because a cause points at something a team can change this quarter. One survey on this asks about causes directly instead of quoting somebody else on outcomes.

The same report puts the share of B2B companies rating their own alignment as very good or excellent at forty one percent.
Read the two together and the picture changes shape. A majority do not rate their own alignment as very good or excellent, and the reasons they give are mostly plumbing, not personality.
It also changes who the work belongs to. A communication problem belongs to two managers and a standing meeting. A data problem belongs to whoever owns the systems, and they can close it.
That is the practical case for starting at the definitions, not at the relationship. The definitions are the smallest piece of the problem that can be finished.
Plumbing has a price and a date. A shared definition costs a meeting, a data cleanup costs a quarter, and neither of them needs a 2010 study to justify.
Suppose the definitions are agreed and the demand is the gap: that is the B2B PPC agency work at Addition, a search marketing agency.
Four sales and marketing alignment mistakes to check
Four failures turn up again and again, and each one costs credibility, not money, which is a good deal harder to get back once it has gone.
Four habits and what each one hides.
| Habit | What it hides |
|---|---|
| Quoting a benefit figure without its year | That the measurement predates the tools it is used to justify |
| Treating alignment as a relationship problem | The three data and process obstacles the same survey measures |
| Agreeing on definitions verbally | That nobody can show what was agreed when the argument restarts |
| Leaving the return path undefined | Every lead sales declined and marketing never saw again |
The third deserves the extra sentence. A definition that lives in a meeting cannot drift visibly, so both teams keep believing they agreed while their thresholds move apart.
Writing it into the tool, with a date, turns a disagreement about memory into a disagreement about a number. The second kind is the kind that gets settled.
The second habit has a measured counterweight, and it is the survey charted above. Teams name four obstacles, and three are about data. Data problems have owners, tickets and dates.
A quarter spent joining two systems is a smaller project than a culture programme, and it leaves something behind that can be checked next quarter.
How to measure sales and marketing alignment
Alignment surveys measure how people feel about the other team. Check that once a year. What tells you whether the handover works is countable every month.
Count the leads marketing passed, the leads sales accepted, and the gap between them. A rising gap is the definition drifting, and it shows up before anyone raises it in a meeting.
Count the declined leads that came back to marketing. If that number is zero, the return path is missing, not empty.
Split acceptance by source once a quarter. A single account level acceptance rate hides the channel the two teams are really arguing about, and it is usually one channel, not the programme.
Keep the process itself cheap, because the time it spends is selling time. Salesforce asked 4,050 sales professionals across 22 countries in August and September 2025 and found the average seller giving 40 percent of the week to selling.
Keep the window short enough to act on. A monthly read shows drift while it is still a definition problem, and a quarterly one shows it after somebody has already built a case around it.
What to report, how often, and what it answers.
| Number | Window | What it answers |
|---|---|---|
| Leads passed and leads accepted | Monthly | Whether the two thresholds still meet |
| Acceptance rate by source | Quarterly | Which channel the disagreement is really about |
| Declined leads returned | Monthly | Whether the return path exists |
| Date the definitions last changed | Whenever it changes | Whether drift is a memory problem or a real one |
What the accepted leads are worth after that is the subject of cost per lead, and the stage counts they move through are in the B2B marketing funnel.
Two of these rows may already be recorded in your CRM. The other two need somebody to decide what counts, which is the same decision the definitions document settles.
Sources
- Salesforce guide Sales and Marketing Alignment: A Complete Guide, no date shown on the page
- Outfunnel Sales and marketing alignment, by Ema Kaplani, updated September 2025
- SuperOffice Sales and marketing alignment, by Steven MacDonald, updated 9 November 2023, carrying eleven statistics
- Highspot 7 steps to achieving sales and marketing alignment
- INFUSE 7 sales and marketing alignment best practices
- DealHub Sales alignment glossary entry
- ZoomInfo Sales and marketing alignment, the 2026 guide
- Imanta What is marketing and sales alignment
- Le Meunier-FitzHugh and Piercy, Journal of Personal Selling and Sales Management 27(3), 207-220, 2007 Does collaboration between sales and marketing affect business performance? Abstract read on the University of East Anglia research portal; the paper itself sits behind a publisher paywall
- Salesforce State of Sales, seventh edition: 4,050 sales professionals in 22 countries, fielded August to September 2025, reporting the average seller spending 40 percent of their time selling
- Wim Biemans, Avinash Malshe and Jeff S. Johnson, Industrial Marketing Management The sales-marketing interface: a systematic literature review and directions for future research, volume 102, April 2022, pages 324-337, covering more than 25 years of research and stating that it identifies and resolves inconsistencies and definitional ambiguities
- Philip Kotler, Neil Rackham and Suj Krishnaswamy, Harvard Business Review Ending the War Between Sales and Marketing, July to August 2006, the origin of the four-stage framework the vendor pages reuse
- Content Marketing Institute B2B Content Marketing Benchmarks, Budgets and Trends 2025, 980 B2B respondents, fielded 25 June to 16 August 2024
- Content Marketing Institute B2B Content and Marketing Trends: Insights for 2026, 1,015 B2B marketers, fielded 24 June to 14 August 2025
- Aberdeen Group CMO’s Agenda research, the origin of the most quoted pair. The address here is the SuperOffice page that quotes it, since the report itself is not reachable; the 2010 date comes from secondary sources
Questions people ask
What is sales and marketing alignment?
The coordination of goals, definitions and data between the two teams. The standard phrasing is the strategic coordination of goals, processes and communication between the two departments.
That definition is settled. The evidence for the benefits usually attached to it is not.
Does sales and marketing alignment increase revenue?
The most quoted figures say aligned teams grow revenue twenty percent a year against a four percent decline for misaligned ones. Traced back, that pair rests on a 2010 study. The pages in between link onward to one another, and the last of them credits the study without linking it.
The effect may well be real. The figure is not evidence a reader can check.
What causes sales and marketing misalignment?
The one first party survey here ranks poor communication first at 42 percent, then inaccurate prospect data at 34, lack of accountability at 30, and scattered customer data at 29.
Four obstacles appear. Data and process cause three, so they need operational repairs.
What should the two teams agree on first?
Three definitions: the ideal customer profile, the marketing qualified lead threshold and what sales acceptance means. Naming them is the easy half; the number that turns each one into a filter is the part left blank.
Add a fourth that most accounts skip: what happens to a lead sales declines.

