What does AI share of voice measure?
Every definition of AI share of voice is a fraction: your brand mentions on top, all brand mentions underneath. The interesting half is underneath, and the published definitions do not agree about what is down there.
The denominator is a chosen prompt set, not the category.
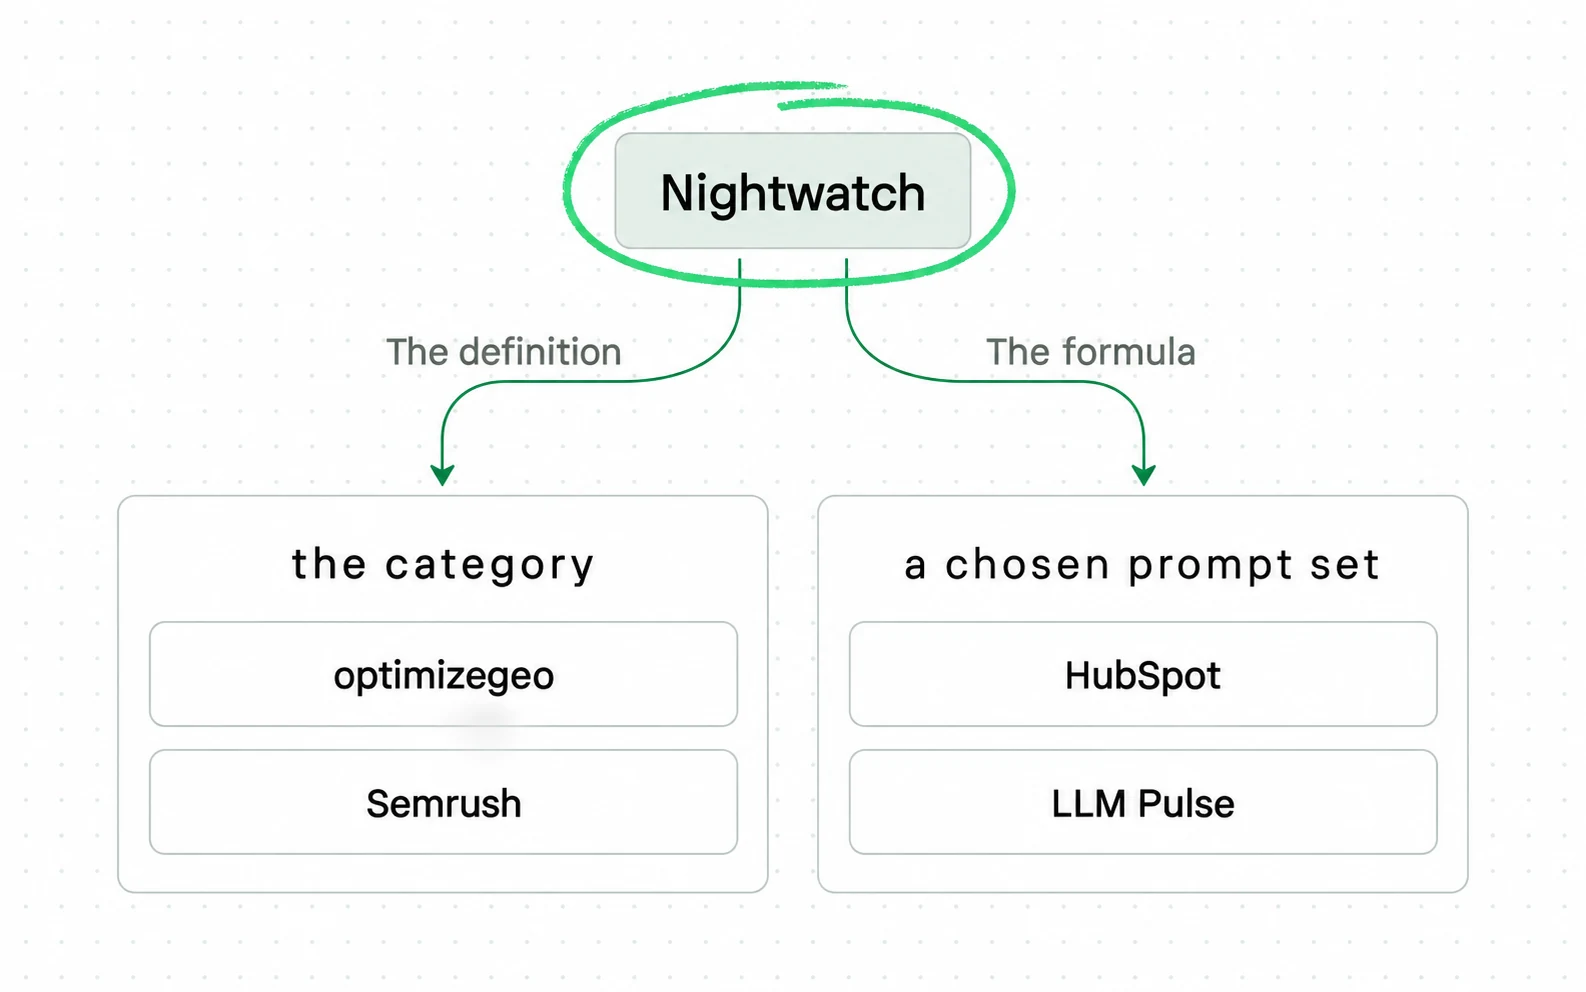
The clearest case is the first row, because it needs no comparison across sources. Both answers sit on one page.
The formula: (your brand mentions / total category mentions across tracked prompts) x 100 Your SOV score varies by platform … you might appear frequently in ChatGPT and barely register in Perplexity
Nightwatch, AI share of voice (Nightwatch sells rank and AI tracking) read 7 October 2026
- The formula is printed: your brand mentions over total category mentions across tracked prompts, times one hundred.
- The next bullet says the score varies by platform, and gives the example of appearing often in ChatGPT and barely registering in Perplexity.
- Both lines are true and they do not sit together comfortably. A single percentage cannot carry a number that changes with the platform it was measured on.
Mentions are counted across a defined set of prompts, and two of the definitions put that in writing. Semrush describes the denominator as all brands in your category and names no prompt selection or sample size.
A second page calls it the percentage of AI-generated responses in your category that mention you, then names a prompt set in the instructions underneath. Its definition and its method are counting different things.
A third page defines the metric and never says what the denominator is at all. Google’s own AI answer puts it relative to your total category competitors, a denominator none of the tools here measures.
One platform sells two numbers under the one name, a mention-based share and a citation-based share, and they count different events in the same answer. Why those two events are not interchangeable sits in what AI visibility is.
Why can't you audit the AI share of voice denominator?
The reason this matters more here than in the metric it borrowed its name from is arithmetic, not ethics. The set of prompts a person could ask an answer engine has no edge, so nobody can compute the true total.
The name came from somewhere, and so did an expectation.
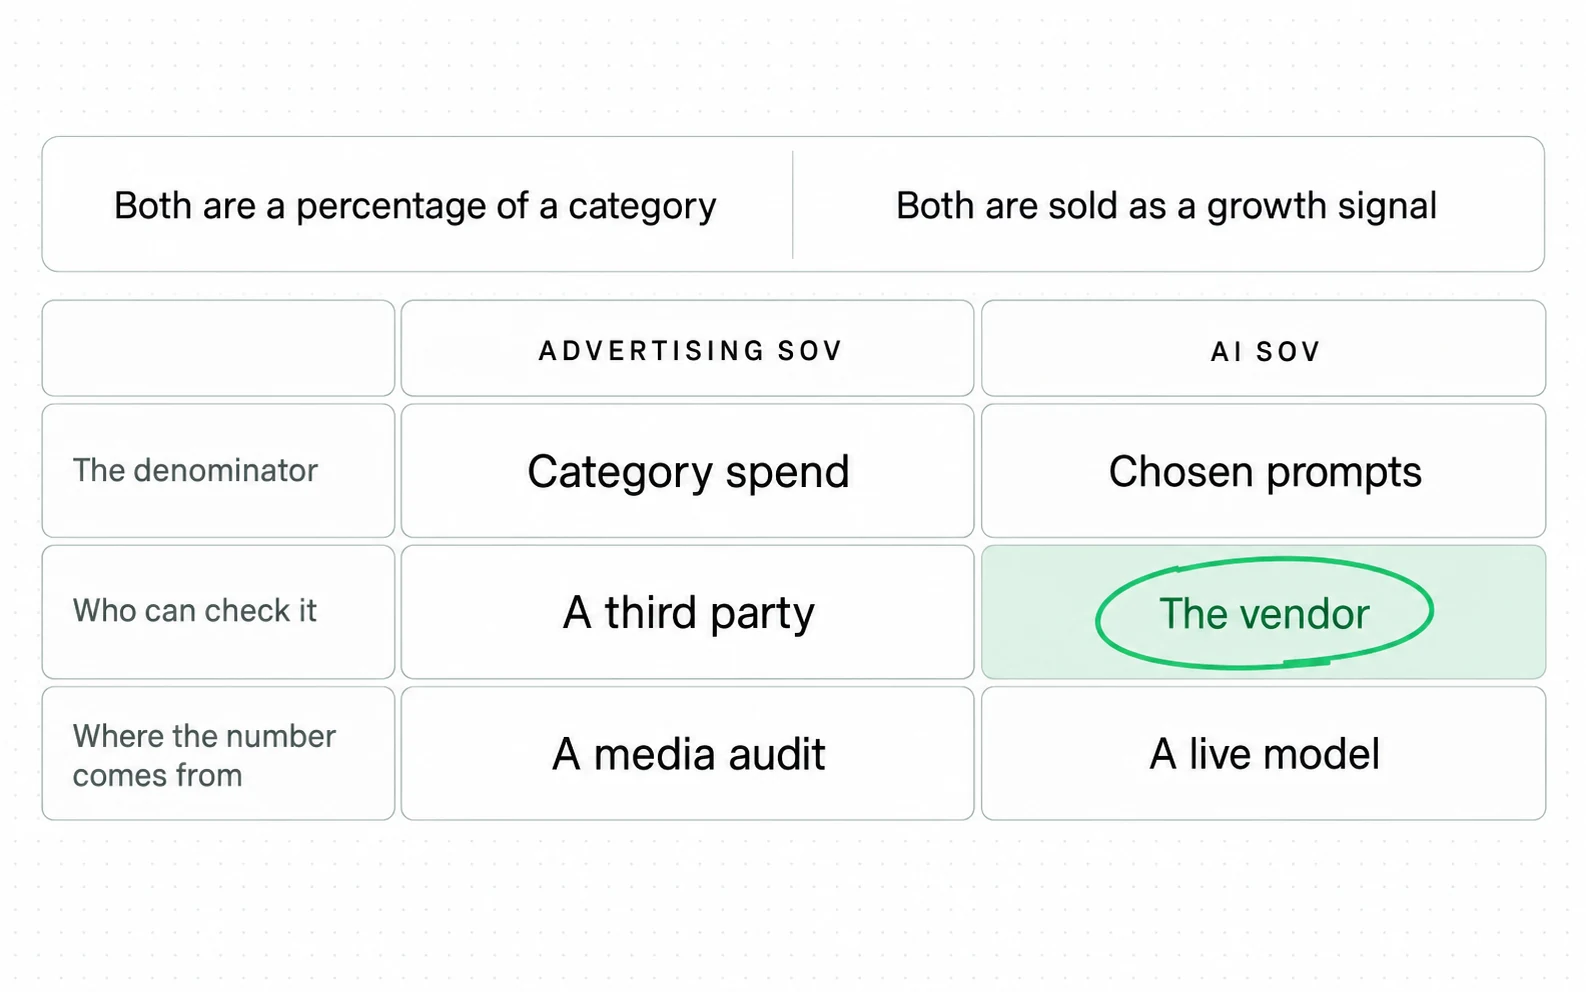
The advertising version has a number attached. What matters here is the shape, not the size.
The universe of possible prompts is effectively infinite, so a vendor selects a small subset of static prompts and aggregates those outputs into a percentage that reads as global. Dan Taylor calls the result a hidden denominator.
The definitions do not hide it. One writes the denominator into its own as total brand mentions across tracked prompts.
And the answers the set produces do not hold still while you measure them.

Questions to ask before trusting the metric
Settle one shorter thing first, because it decides whether either of those questions is worth asking. What does your own vendor divide by? None of this makes the metric useless; it makes it a measurement with a stated sample, and the difference is four questions long.
Say you want the DIY version of the count. The ai-seo skill writes it out for you: twenty queries, three to five runs each, the rate with its n.
An undisclosed sample makes the percentage unreadable from outside.
| Ask your vendor | Why it decides the number | What a non-answer means |
|---|---|---|
| How many prompts are in your set | The denominator is total mentions, and the prompt set is what produces them. A share computed over 40 prompts and one over 4,000 are not the same quantity | The percentage cannot be compared to anyone else’s |
| Who chose them, and how | A set built from your own category language will read differently from one built from a template | You are reading the vendor’s view of your category |
| Mentions or citations | The same name covers a mention share and a citation share, and they count different events | Two dashboards will disagree and both be right |
| How often each is run | The list moves between runs, so a single pass gives a draw | The trend line may be sampling noise |
Taylor’s constructive half is worth taking as well, because it separates one number into three that fail differently. Share of mentions is how often you are named. Share of recommendations is how often you are named when the question asks the engine to advise. Share of narrative is what gets said about you when you are named. His example should worry anyone reporting a single figure. A brand can hold a high share of voice while being consistently described as a complex legacy system, in which case the number is going up while the pipeline goes down.
A good percentage depends on the category
The most common question about this metric is what number to aim for. It has an answer, and the answer is that the question is malformed unless the category is specified.
A number is a verdict only once the field is counted.
One definition states it plainly: a good percentage depends entirely on your market’s competitive context. In a category with two serious players, 50 percent suggests parity. In a fragmented category with ten alternatives, 15 percent may be category leadership. A benchmark quoted without the number of competitors behind it is not a benchmark.
The same page offers the closest thing to a distribution anyone publishes. Most B2B brands appear in under 30 percent of relevant category queries, regardless of their conventional search rankings. That is one vendor’s observation, not a study, and it is useful in one direction only. If your number is far above it, the first thing to check is the size of the prompt set, not the strength of the brand.
Read the practitioner case against that. A practitioner published a piece on LinkedIn explaining why AI share of voice became his primary metric for the year. He tracks what he describes as thousands of queries in real time. His stated reason is that a buyer asking an engine for the best platform in his category either sees his product or does not. The disclosure stops in the same place as everyone else’s: the piece does not say how many prompts, or how the set was chosen. The percentages it shows are illustrative, not data.
One published method does state its own. The GEO paper by Aggarwal and colleagues appeared at KDD 2024. It sets out a framework for defining visibility metrics, then publishes the benchmark it was tested on.
That is the disclosure every page above skips, and the one to ask your own vendor for. You can disagree with their metric and still see what it counted, over which queries. That is the difference between a measurement and a claim.
Measuring your own share, with the swing between runs reported, is AI visibility monitoring at Addition, an AI search agency.
Four ways AI share of voice misleads
If a benchmark cannot be borrowed from outside, the remaining risk is inside your own reporting, and it is four specific readings. Three come from the prompt set behind the denominator being invisible, and the fourth from two different numbers sharing a name.
The number can rise while nothing about you changed.
| The mistake | What the evidence says | What to do instead |
|---|---|---|
| Comparing your share to a competitor’s published share | The two are computed over different prompt sets, which are the denominators | Compare inside one tool, and only when the set is the same |
| Reading a rise as more visibility | Changing the prompt set changes the denominator, so the share can move with no change in behaviour | Ask what changed in your prompt set before reading the line |
| Reporting one figure from one run | The same prompts returned the same brand list under one time in a hundred | Report the set size and the repeat count next to the number |
| Treating mention share and citation share as one metric | The same name covers a mention share and a citation share, and they count different events | State which one the figure is, every time |
The fifth one you cannot fix from your side. Almost every number in this field is published by a company selling visibility tracking. That does not make the numbers wrong, but none of them has been checked by anyone independent. What you can check is the wording: every definition above is quoted or linked, so you can read it at the source.
How to record AI share of voice so it stays readable
If you keep this metric, the fix is not a better formula. It is recording the sample beside the percentage, every time, so that next quarter’s number can be compared to this one.
Write the sample next to the share.
Four values make the figure comparable to your next one. How many prompts. How they were selected. Whether a mention or a linked citation increments it. And how many times each ran. They do not make it reproducible by anyone else; that would take the prompts themselves. What they tell you is whether the sample behind this month is the sample behind last month. A share of voice reported without them is a number that cannot be checked, including by the person who reported it three months later.
What your own analytics will and will not separate sits in how to measure AI visibility. What the underlying score is made of is in the AI visibility guide.
What is AI share of voice good for?
It is a usable internal trend line and a poor external benchmark, for the same reason in both cases. Whoever chose the prompt set decided what the denominator counts.
Keep it inside one instrument, and record the sample.
Held still, meaning the same prompts, the same engines and the same counting rule, the percentage becomes readable as your own series. It does not become stable: the answers still move between runs, and platform changes set a floor on precision that no amount of repetition beats. What holding the configuration still removes is the movement you caused. Set beside a competitor’s published figure, or beside a benchmark from a different category, it is comparing two fractions built over different samples. Inspeccia, which sells a visibility product, sizes that instability from another angle with its own production data. Across 167 domains measured twice, the visible ones moved by an average of 30.8 points. That is what a percentage inherits when the counts underneath it move. That is not a small caveat about a good metric; it is the whole reading.
Sources
- Aggarwal, Murahari, Rajpurohit, Kalyan, Narasimhan and Deshpande GEO: Generative Engine Optimization, KDD 2024, a black-box framework for defining and optimising visibility metrics in generative engine responses, evaluated on the published GEO-bench benchmark of user queries across multiple domains
- Dan Taylor, Search Engine Land The problem with AI share of voice: the universe of possible AI prompts is effectively infinite, and vendors aggregate a small arbitrary subset into a representative global percentage
- LLM Pulse Share of voice: the denominator is total brand mentions across tracked prompts, and a good percentage depends entirely on the competitive context. LLM Pulse sells visibility tracking
- Nightwatch AI share of voice: the definition says all brand mentions for your category, and the formula on the same page says total mentions across tracked prompts This page carries no publication date of its own.
- HubSpot AI share of voice glossary: mentions across a defined set of prompts, and across the prompts that matter most to your industry This page carries no publication date of its own.
- optimizegeo AI share of voice: the percentage of AI-generated responses in your category that mention your brand, with the prompt set named later in the instructions
- Semrush How to measure AI share of voice: your AI mentions divided by total AI mentions across all brands in your category. Semrush sells a visibility toolkit
- Conductor Competitive AI share of voice: a mention-based share and a citation-based share, sold under one name This page carries no publication date of its own.
- netranks Measuring and improving AI share of voice: a definition with no formula, no denominator and no prompt-set disclosure
- Nielsen Budgeting for the Upturn: a ten point difference between share of voice and share of market is associated with about 0.5 percent extra market share growth
- Rand Fishkin, SparkToro AIs are highly inconsistent when recommending brands: 12 prompts run a combined 2,961 times, and the same brand list returned under one time in a hundred. SparkToro sells audience research software
- Greg Jarboe, Search Engine Journal Clovion data: a single follow-up question changed 62 percent of AI brand recommendations
- Profound Is once a day enough: 753 prompts across seven platforms for two weeks, once a day against ten times a day. Profound sells a visibility platform
- Inspeccia Why AI visibility tools disagree: production data across 2,324 audits and 2,021 domains. Inspeccia sells a visibility product
- Google Search results for “ai share of voice”
Questions people ask
What does AI share of voice mean?
Your brand mentions divided by all brand mentions across a set of prompts, times a hundred. The set is the part that varies. Some tools call it a defined set of prompts, others call it your whole category, and one uses both wordings a few paragraphs apart.
Those are different quantities. A share of a chosen sample can be measured; a share of a category cannot, because nobody can count all the questions people might ask.
What is a good share of voice percentage?
The number alone does not carry a verdict. It depends on the market. In a category with two serious players 50 percent suggests parity; in a fragmented category with ten alternatives 15 percent may be leadership. That is how one of the definitions puts it.
The same source offers one rough distribution, that most B2B brands appear in under 30 percent of relevant category queries. Read it as a sanity check, not a target, and if your figure sits far above it, look at the size of the prompt set first.
How is AI share of voice calculated?
The formula is your mentions divided by total mentions, times a hundred. The arithmetic is not where the disagreement is: the denominator is.
One vendor also sells two versions of the number, one counting mentions and one counting citations. Those count different events in the same answer, so a figure is only comparable to another figure computed the same way.
Is AI share of voice the same as share of voice in advertising?
It borrowed the name and not the auditability. Advertising share of voice divides by measured category media spend, which a third party can audit and which does not change when you measure it again.
The AI version divides by a prompt set the vendor chose, out of a pool of possible questions with no edge. And the same prompts return different brand lists on a re-run. The advertising metric also has a measured relationship behind it, which Nielsen reported as roughly half a point of market share growth per ten-point gap between share of voice and share of market.