What does an AI visibility score describe?
Before the tool, know what its number is. It is not something your brand has. It is a rate computed over a set of prompts somebody chose, with a formula somebody picked, on whichever engines that plan covers.
LLM Pulse publishes the arithmetic behind its number. If the term itself is your question, what AI visibility is covers it in one page.
LLM Pulse sets out both calculations on its own methodology page. A mention rate is mentions divided by total evaluations. A weighted AI visibility score takes one divided by the position of each mention, adds those up, then divides by evaluations. So a first-place mention counts four times a fourth-place one. The same page states that the score is built from mentions and does not include citations.
Semrush read 126 million United States prompts from January to April 2026 for its AI Visibility Index. Only 36 brands held top-100 visibility on all four platforms in every month, so your single number hides which engine produced it.
Two calculations on one dataset

That distinction between a mention and a citation is not a detail, and it is easier to see than to describe. The shorter definition of the neighbouring term sits in answer engine optimization.
Three things behind an AI visibility score
The formula is the first. The other two are the engines a plan covers and the prompts it runs. How much each one moves a given brand’s number is not quantified by the studies on this page. What is documented is that all three are choices, not constants. So two tools can describe the same brand and disagree without either being broken.
The variables are plain. Which prompts get tracked. Which engines, and which model version. Whether the tool reads an API or a real interface. And which formula it applies. Tools generate their own prompt sets, and the queried model version may be undisclosed.
Profound measured what the engines do differently, at scale, though not in the currency of a score. One large published study looks at where citations land, and they land differently on each engine.

Why the comparison itself is the problem
The three levers are documented in three separate places: the formula by one vendor, the citation spread across engines by another, the prompt-set effect by a practitioner. None of the three measures the same brand’s score across tools. Side by side they establish something narrower and still enough. A tool picks its arithmetic, its engines and its questions. A tool counting mentions and a tool counting citations are not counting the same event. How far apart the engines push one brand’s score is not quantified by the evidence here. Two tools can report different numbers for the same brand without either being broken.
That is a structural claim, not a measured one, and the difference matters. Without a controlled head to head, the evidence supports comparing mechanics and not estimating the practical gap. So you can say how the instruments differ, not how far apart they land in practice. The mechanics behind the answer engines themselves are a separate subject, taken apart in generative engine optimization and, for Google’s own surfaces, in AI search engine optimization.
Which question does an AI visibility score answer?
Even with one tool, one formula and one engine set, the number describes one particular conversation. A score may cover only opening prompts, and whether it includes follow-up questions changes which part of the conversation it measures. Two vendor studies moved a different part of the conversation to see what happens.
One detail changes the answer.

When the list holds and the recommendation moves
A second study varied the other end of the conversation. Demand Genius changed the opening framing instead of the follow-up, across eight B2B categories, running each path three times. The brands named stayed largely the same: Average brand recurrence was 0.82 across paired runs. The characterisation was retained in only 37 percent of paired runs. The leaders kept appearing, and what the answer said about them changed.
So context does not always remove you. The names largely held while the characterisation did not. A tracker counting mentions would log both runs as an appearance; a position-weighted one might score them differently; neither tells you who ended up recommended. Both studies ran in business software, not retail, so the numbers do not carry to a store. The question does: would your tracker notice an answer changing its mind about a product while still naming it? Underneath a name in the text sit two further states a citation paper keeps apart, and the ladder below sets all three out. The practical consequence is that an appearance count can climb in a month when nothing downstream moves. That is the ground ecommerce SEO covers and where AEO vs SEO sets the two side by side.
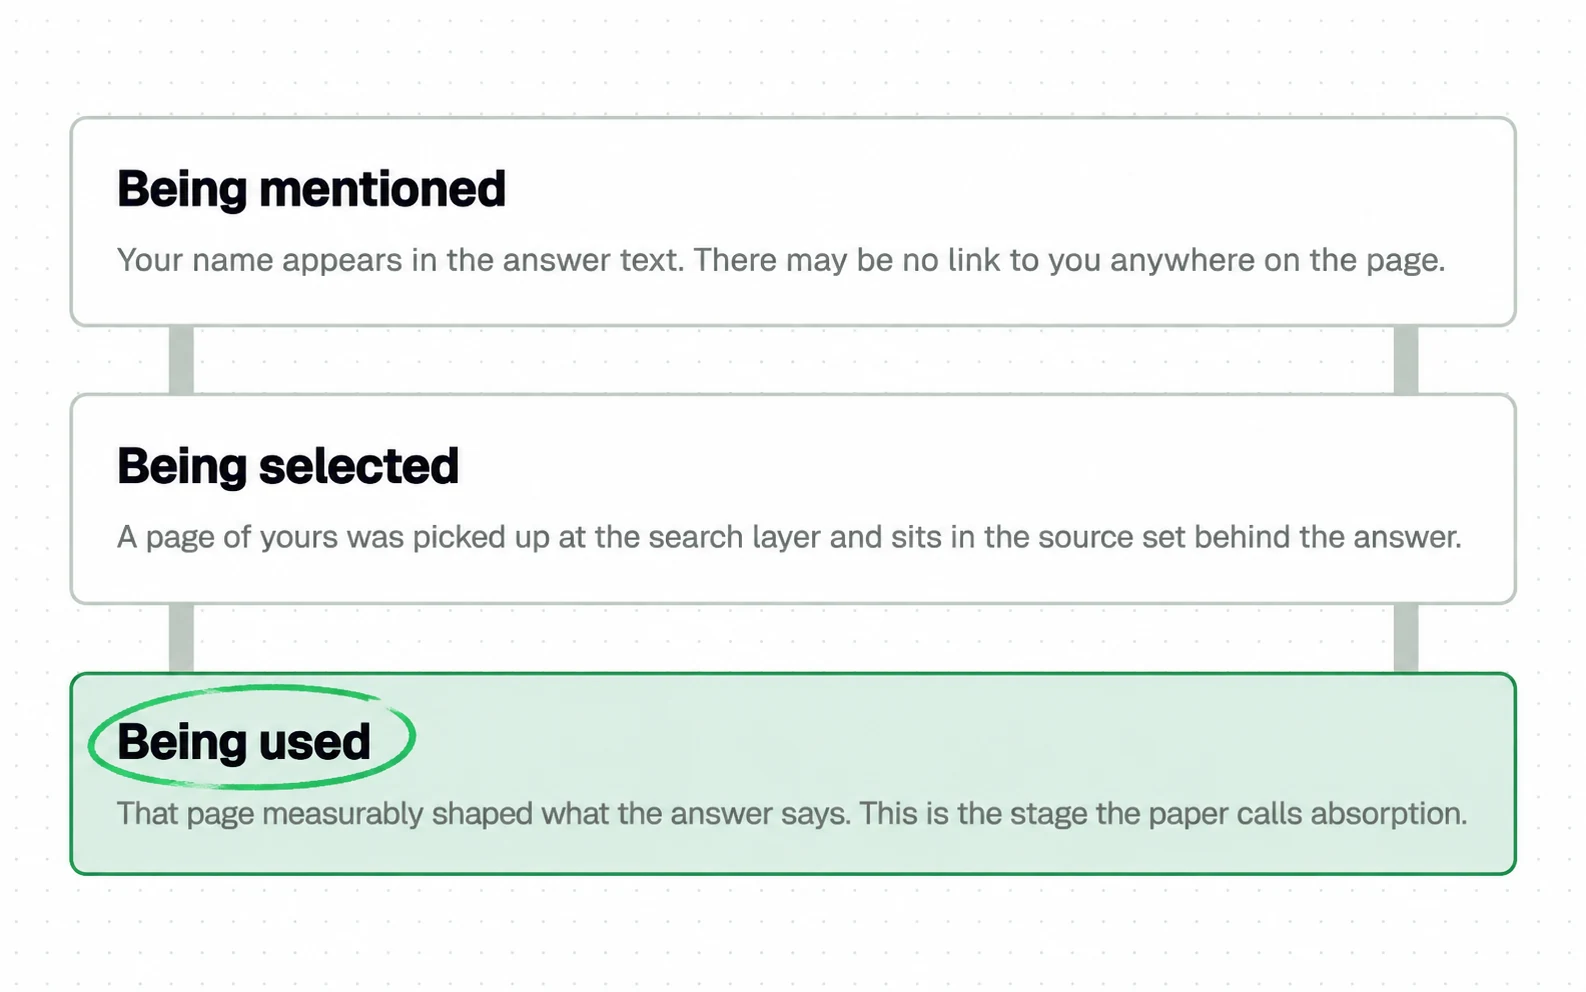
Which tracker draws that ladder for you is a separate purchase, and the recommendations disagree: dozens of products get named, and most of the people naming them sell one. The three that appear in nearly all of those lists are compared in AI visibility tools.
How to read an AI visibility score as a trend
None of this makes the number useless. The study that measured the instability also named the fix: run each prompt many times instead of once. The rest follows from the instruments. Use one tool, hold it still, and read it against its own baseline.
SparkToro’s team, led by Rand Fishkin, ran 12 prompts through three engines 2,961 times with 600 volunteers. The odds of seeing the same brand list twice came out under one in a hundred. The same order, under one in a thousand. The same study concluded that a visibility percentage measured across many runs is statistically valid.
Schulte and colleagues reach the same place from the research side. Answers vary across runs, prompts and time, so visibility has to be described as a distribution, not a single-point outcome.
Answers can vary across runs, prompts, and time, making one-off observations unreliable. Drawing on empirical studies, our findings underscore the need for repeated measurements to assess a brand's GEO performance and to characterize visibility as a distribution rather than a single-point outcome.
arxiv.org, Do Not Measure Once: Measuring Visibility in AI Search read 10 September 2026
- The abstract draws the same line the practitioner study did, from the other side: classical search gives a representative snapshot, and AI search does not.
- A preprint, and the frame shows it: an arXiv identifier and a DOI, no journal. That is enough to find it and not enough to call it reviewed.
Suppose you want that ordinary work organised. The seo-aeo-geo skill does it in five layers with a re-test each quarter on your own pages.
-
Fix the instrument before the number
One tool, one formula, one engine set, one prompt list. Changing any of them restarts the series, because the new number is not comparable with the old one.
-
Repeat before you read
A single run is the least reliable version of this measurement. Repeat it, and it turns from a screenshot into a distribution you can report.
-
Compare within one instrument
Hold the formula, the prompts and the engines still, and repeat each question instead of asking it once. Without a disclosed repeat count the stability of the measurement cannot be checked, and picking a small number does not fix that. What it does fix is the comparison, because a figure measured one way against a figure measured another is not a trend at all. Whatever count you settle on, keep it fixed; the same budget spent on more questions buys breadth instead, which the pricing section takes up. Rival and category figures from the same tool usually share its formula and engines, though not always its prompt set. Ask what was asked before you read one beside your own. One thing stays outside your control. If a tool does not publish the model version it queried, a step change with no campaign behind it may be the engine and not you. Two numbers from different tools only meet if both disclose the same six things and match on them. The prompts. How many times each is repeated. The engines and the model version behind them. Whether the tool typed into a chat window or called an API, the formula, and whether a mention or a linked citation increments the score. They are the same six the checklist at the end of this page asks for. Where a tool does not publish one of them, the comparison is not checkable.
-
Write down what moved
Add a prompt, drop an engine or change a plan and the number moves without anything changing on your site. Six months later nobody remembers which it was.
The work underneath the number is the ordinary kind, and it is covered in an ecommerce SEO audit: whether pages are indexed, reachable and carrying something an answer can lift.
Pricing: three incompatible units
Once you need repetition, one line on the price list matters more than the whole feature list: how many observations the plan buys, and how often they refresh. Line up what the three vendors publish and you get three different units.
Read the right-hand column, not the price.
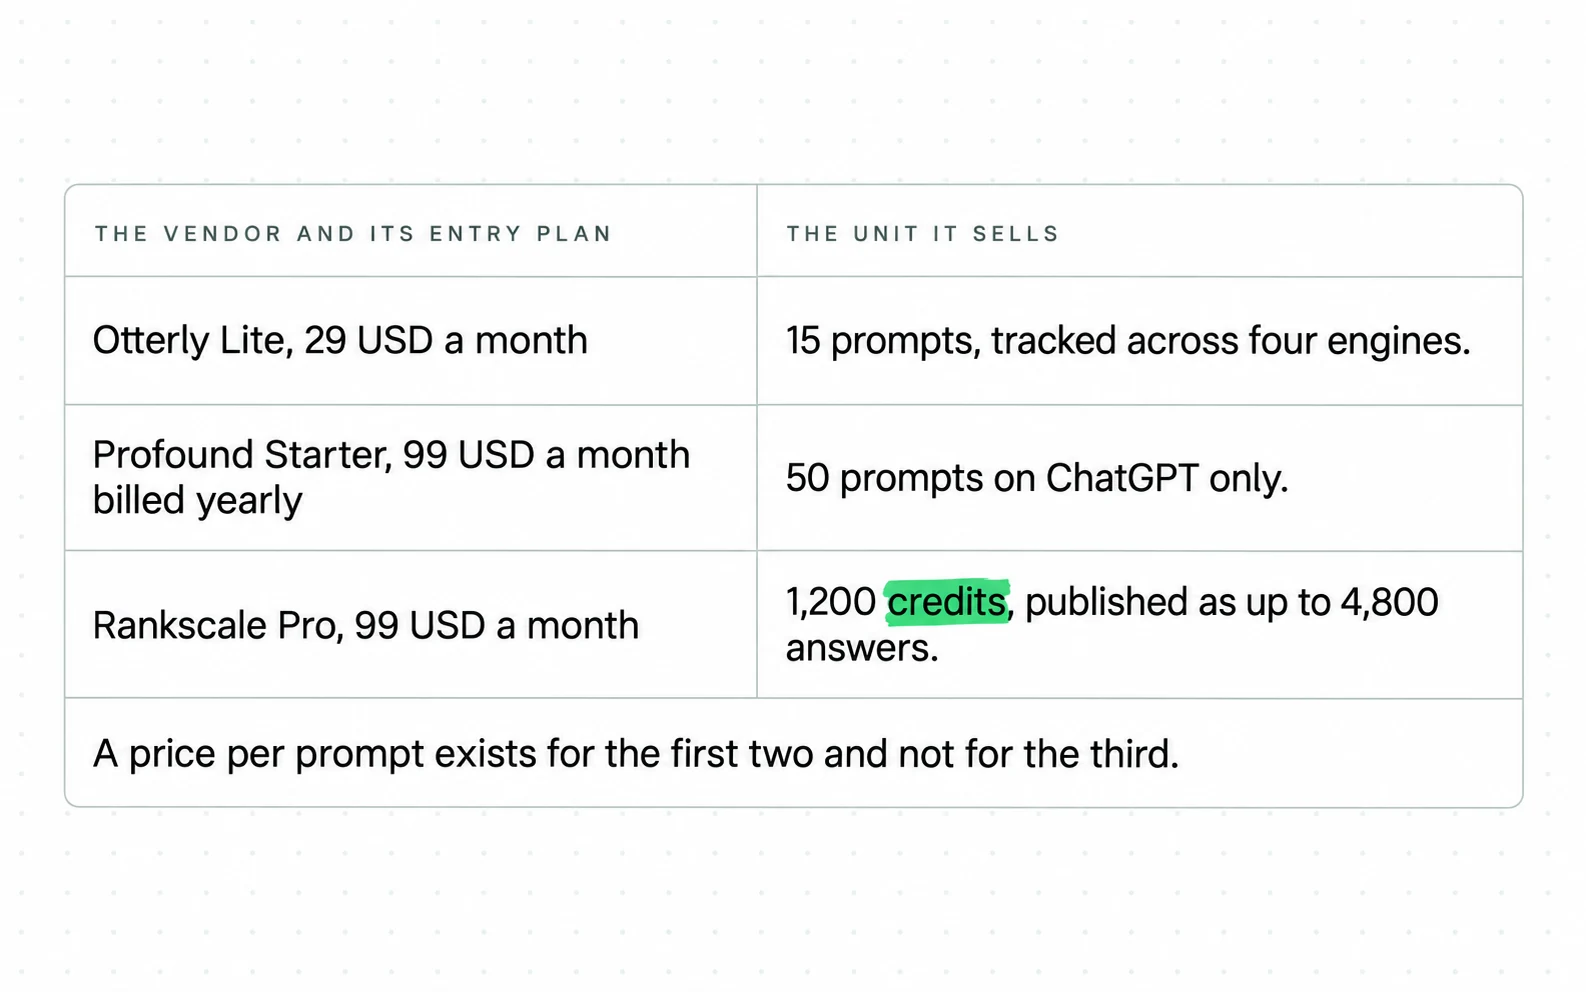
The three are Otterly.AI, Profound and Rankscale, and you are not buying the same unit from each. Otterly.AI and Profound price by tracked prompts, Rankscale by credits with a published conversion into answers.
Set that against the repetition the studies ask for. The instability was measured across repeats of the same prompt. A prompt budget does not tell you how many observations come from breadth and how many from repeated runs. What each of them does publish is a budget: tracked questions for the first two, answers for the third. A budget can be spent on breadth or on repetition, and how it is allocated is not stated. To price the studies’ requirement, ask how each plan splits observations between breadth and repeated runs.
If the work behind the number is what you want handled, not the dashboard, that is what Addition, an AI search agency, takes on.
Four ways to misread an AI visibility score
Reading a score inside one instrument rules out four readings people reach for first. The mistakes here are not exotic. Each one comes from treating a sampled, formula-dependent rate as if it were a rank. Two of them have a measurement behind them; the other two rest on what the instruments and the platforms say.
The first is comparing two tools.
| The mistake | What the evidence says | What to do instead |
|---|---|---|
| Comparing your score in one tool with a score from another | All six choices behind the number, from the prompt set to whether a mention counts, are made per tool, and a comparison is only checkable when both tools publish all six | Compare inside one tool; two tools only meet if all six match and both publish them |
| Reading a single run | Repeated measurement of the same brand moved the result for 56.9 percent of visible domains, by an average of 30.8 points | Repeat, then read the distribution |
| Treating a mention as a citation | One published score is built from mentions and does not include citations, and the two diverge on the same answer | Ask which one your dashboard counts |
| Waiting for AI traffic to be counted separately | Google documents these visits as counted inside overall search traffic under the Web search type | Read the total, knowing it merges them in and that unclicked appearances never arrive |
Ronald Sielinski reaches the same place from the statistics. His arXiv preprint on quantifying uncertainty in AI visibility finds that a metric read once looks more precise than its sampling can support.
The second mistake deserves its own numbers, because the size of the swing depends on which population you count, and Inspeccia says so itself.

A fifth mistake has its own page: reading AI share of voice as a share of your category when it is a share of a prompt set somebody chose. The third mistake is reading a mention as a citation, and the split at the top settles it. A name in the sentence and a link under it are counted by different tools in different ways. The fourth is the quietest, because nothing looks broken. Google states three things. A page only needs to be indexed and eligible to appear with a snippet. There are no additional requirements. And AI feature traffic is folded into the Web search type. Google documents these visits as counted inside overall search traffic, which means the total includes them and does not separate them. The total is a traffic number either way, and appearing in an answer without a click never reaches it. The files and markup often recommended for this are a different argument. llms.txt carries the adoption numbers behind one of them. Google’s own answer surfaces are in AI Overviews.
Why can nobody give you one number?
A brand’s starting position is not evenly distributed, so a threshold borrowed from a brand of a different size says little about yours.

The procedure behind the number, meaning what to ask and how often, is how to measure AI visibility. Before you read the number your tool reports, find out what it discloses. How many prompts it runs. How many times it repeats each one. Which engines and which model version. Ask whether it types into the chat window or calls the model through an API, because the two return different answers. Then ask which formula it applies, and whether a mention counts or only a linked citation. Those are the six choices behind any score, and a tool that names none of them is handing you a screenshot, not a measurement.
Sources
- Rand Fishkin, SparkToro AIs are highly inconsistent when recommending brands or products. SparkToro sells audience research software and works in this category
- Inspeccia Why AI visibility tools disagree, production data from 2,324 audits
- Ronald Sielinski Quantifying Uncertainty in AI Visibility, arXiv 2603.08924, preprint
- Schulte, Bleeker and Kaufmann Don’t Measure Once: Measuring Visibility in AI Search, arXiv 2604.07585, preprint
- Clovion, via Search Engine Journal 62% of AI brand recommendations vanish after one buyer question
- Tom Rudnai, Demand Genius Your AI visibility metrics are lying to you: how conversational context shapes AI responses
- Daniel Peris, LLM Pulse AI Visibility Score: how it is calculated
- Ivan Palii, Hack the Algo Four variables that make AI visibility scores differ across tools
- Jasman Singh, Profound Where do AI citations come from, 11.84 billion citations across eight models
- Google Search Central AI features and your website
- Semrush 2026 AI Visibility Index, 126 million United States prompts
- Pratyush Kumar, Ranqo Generative Engine Optimization at Scale, arXiv 2606.20065, preprint
- Zhang, He and Yao From Citation Selection to Citation Absorption, arXiv 2604.25707, preprint
- Otterly.AI Pricing
- Profound Pricing
- Rankscale Pricing
Questions people ask
What is a good AI visibility score?
There is no threshold worth copying. Two tools measuring the same brand can apply different formulas over different prompt sets on different engines. Their numbers are then not the same quantity, and no independent comparison of two trackers on one brand appears among the studies on this page.
What the evidence supports is a relative reading. Kumar’s first-run study of more than 100 brands found appearance rates around 73 percent for household names, 44 for established mid-market brands and 11 for niche ones. Read that as an association, not a target. Read any baseline from the same tool under the same configuration. Start with your own previous months. Add a rival or category figure once you know it was built from the same prompts. What does not transfer is a number carried across from another tool.
How can I check my AI visibility?
Not from Google’s own reporting. It counts visits arriving from AI features inside overall search traffic, under the Web search type, so those visits are in your total, not beside it.
That leaves vendor trackers. Ask each one what it counts: which prompts, how many repeats of each, which engines and which model version, and whether a mention or a linked citation is what increments the score.
Is there a free AI visibility tracker available?
Several vendors publish a free checker. The same caveats apply as to the paid version, plus one more. A checker that gives you a figure without saying how many times it asked has told you nothing about how steady the figure is.
Repeated measurement of the same brand changed the result for 56.9 percent of visible domains in Inspeccia’s production data, by an average of 30.8 points. A one-off reading sits inside that swing, not above it.
What are AI Visibility Services?
The measurement is the small part. The name covers two different things, and the larger one is the work behind the number. Making pages retrievable. Giving answers something specific to lift. And watching the same instrument over months instead of switching tools when the figure dips.
What that looks like as an engagement is on our AI SEO agency page.